
Indicator documentation "FakeBreaks.mq5"
Overview
The "False Breakouts.mq5" indicator is designed to identify and mark on the chart:
- Buy Points and Sell Points based on false breakouts of support and resistance.
- Dynamicsupport and resistancelevels.
- Markettops and bottoms.
It uses buffers to store and display this information on the chart, making it easier to visually analyse false breakout patterns.
Code Structure
Indicator Properties
- Indicator Name: FalseBreakouts.mq5
- Version: 1.00
- Display Window: Main chart ( indicator_chart_window ).
Buffers and Plots
The indicator uses 6 buffers to store data and 6 plots to display it on the chart:
- Buy:
- Type: DRAW_ARROW (up arrow).
- Colour: Blue (clrBlue).
- Width: 5.
- Sell:
- Type: DRAW_ARROW (down arrow).
- Colour: Red ( clrRed ).
- Width: 5.
- Support:
- Type: DRAW_LINE (solid line).
- Colour: Blue (clrBlue).
- Resistance:
- Type: DRAW_LINE (continuous line).
- Colour: Red ( clrRed ).
- Bottom:
- Type: DRAW_ARROW (down arrow).
- Colour: Red ( clrRed ).
- Top:
- Type: DRAW_ARROW (up arrow).
- Colour: Blue ( clrBlue ).
Global Variables
- ExtResistancesBuffer[] : Stores the resistance levels.
- ExtSupportsBuffer[] : Stores the support levels.
- ExtTopsBuffer[] : Stores identified tops.
- ExtBottomsBuffer[] : Stores identified bottoms.
- ExtSellBuffer[] : Stores the selling points.
- ExtBuyBuffer[] : Stores the buy points.
Main functions
1. OnInit()
- Purpose: Initialises the indicator and maps the buffers.
- Actions:
- Maps the buffers to the plots.
- Sets empty values ( PLOT_EMPTY_VALUE ) for the buffers.
- Sets the arrows (icons) for Buy and Sell.
- Defines the displacement of the arrows on the graph.
2. OnCalculate()
- Purpose: Calculates and updates the buffers with each new candle or tick.
- Actions:
- Checks for new data to process.
- Initialises the buffers if necessary.
- Identifies tops ( IS_TOP ) and bottoms ( IS_BOTTOM ) based on the high and low prices.
- Updates the resistance, support, top and bottom buffers.
- Calls the IsBuy() and IsSell() functions to identify buy and sell points.
3. IndexNextPoint()
- Purpose: Finds the index of the next valid (non-zero) point in a buffer.
- Use: Used by the IsBuy() and IsSell() functions to identify the most recent reference point.
4. IsBuy()
- Purpose: Checks for a buy signal based on a false break of support.
- Logic:
- Checks whether the current price is above the reference point (support).
- Confirms if there has been a false breakout (price falls below and then returns above support).
- Returns true if the conditions are met.
5. IsSell()
- Purpose: Checks for a sell signal based on a false breakout of resistance.
- Logic:
- Checks whether the current price is below the reference point (resistance).
- Confirms if there has been a false breakout (price rises above and then returns below resistance).
- Returns true if the conditions are met.
Operating Logic
-
Identification of Tops and Bottoms:
- A top is identified when the high of the current candle is higher than the highs of the adjacent candles.
- A bottom is identified when the low of the current candle is lower than the lows of the adjacent candles.
-
Updating Support and Resistance:
- The last identified top is stored as resistance.
- The last identified bottom is stored as support.
-
Buy and Sell Signals:
- A buy signal is generated when the price breaks through a support and then returns above it.
- A sell signal is generated when the price breaks through resistance and then returns below it.
Example of use
- The indicator can be applied to any chart in MetaTrader 5.
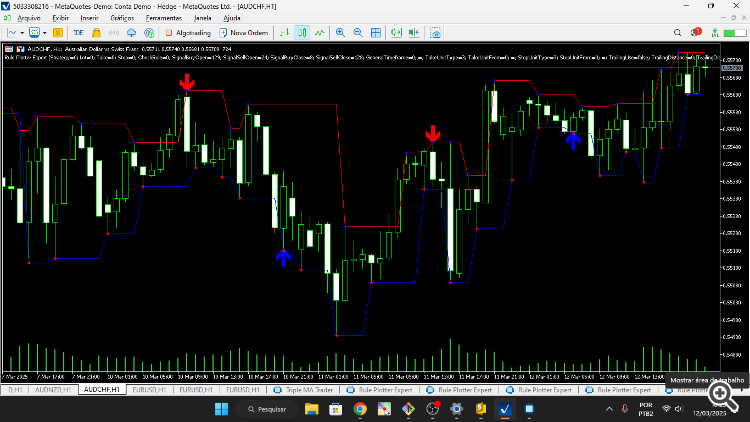
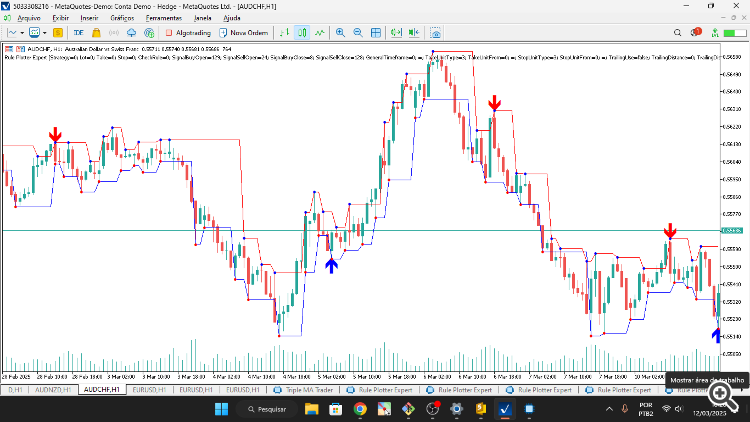
- It will display:
- Blue arrows for buy points.
- Red arrows for sell points.
- Blue lines for support.
- Red lines for resistances.
- Additional arrows for tops and bottoms.
Final considerations
- The indicator is useful for traders who trade on the basis of false breakouts of support and resistance.
- It is recommended to test the indicator on different markets and timeframes to validate its effectiveness.
- It can be customised to include sound alerts or notifications when a signal is generated.


