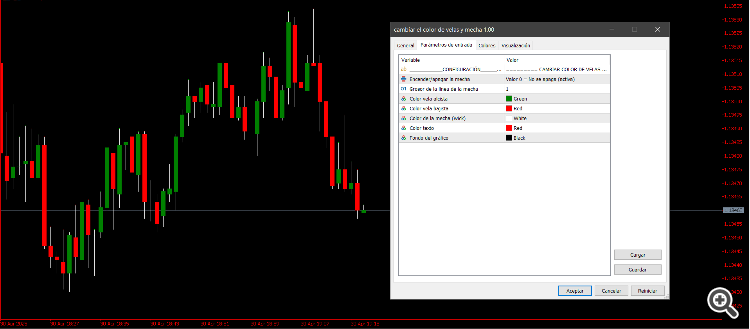
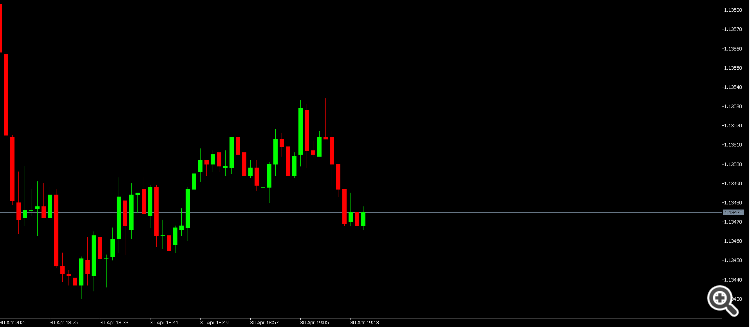
Draw the wicks (thin lines): Draw a vertical line from the lowest price to the highest price of each candle (this is called a "wick"). Draw the body of the candle: Draw a rectangle from the opening price to the closing price, using a different colour if the candle is bullish or bearish. Colour customisation: You can easily change the colours used for bullish and bearish candles and their wicks.
In the code you use, for example: The bearish candles have a maroon body (clrMaroon). The wicks of the bearish candles are light violet (clrOrchid). What is it useful for? This indicator is useful if you want to: Have a unique and clear visual style on your charts. Differentiate bullish candles more easily from bearish ones. Analyse the price behaviour in a more visual way.