
Main Ideas Incorporated in the Code
-
Candle Size Calculation :
- The indicator measures the amplitude of the candles (difference between high and low) and displays the value in points or pips.
- Different colours are used to distinguish bullish and bearish candles, making visual interpretation easier.
-
Customisation by Day of the Week :
- Allows you to process candles from a specific day of the week (e.g. Monday, Tuesday, etc.) or every day.
- It assigns unique colours to each day of the week, making it easy to observe daily patterns.
-
Dynamic Text Positioning :
- Text can be moved vertically in relation to the candle to avoid overlapping with other chart elements.
- Automatically adjusts the position of the text to remain within the visible limits of the chart.
-
Style and Formatting :
- The user can customise the font, font size, colour and anchor type of the text.
- Supports different line styles (e.g. dashed, dotted) for better visualisation.
-
Automatic Cleaning :
- When detaching the indicator from the chart, all objects created are automatically removed to keep the chart clean.
Description of External Variables
All the user-configurable external variables are described below:
Number of numbered candles to be processed. | |
InpMCConfigOptimistic | Optimistic calculation type (e.g. maximum). |
InpMCConfigPessimistic | Pessimistic calculation type (e.g. minimum). |
InpMCCorOptimistic | Colour for bullish candles. |
InpMCCorPessimistic | Colour for bearish candles. |
InpMCConfigFountain | Font of the text displayed on the chart. |
Sunday , Monday , etc. | Specific colours for each day of the week. |
Line style (e.g. dashed, dotted). | |
Line width. | |
Distance of the text from the top of the graph. | |
Font of the text displayed in the graph. | |
InpFontSize | Font size. |
Type of anchor for the text (e.g. top, bottom, centre). |
Recommended Instruments and Timeframes
- Instruments : This indicator can be used with any financial instrument available on the MetaTrader 5 platform, including currency pairs, indices, commodities and cryptocurrencies.
- Timeframes : It works on all timeframes, from 1-minute charts to weekly charts. However, it is recommended to use larger timeframes (e.g. H1, D1) to get a clearer and more accurate analysis of volatility.
Indicator interpretation
-
Candle size :
- A larger candle indicates greater volatility during the period.
- A smaller candle suggests less activity or consolidation in the market.
-
Colours :
- Bullish candles are displayed in a specific colour (e.g. gold).
- Bearish candles are displayed in another colour (e.g. grey).
-
Days of the week :
- Assigning different colours to each day of the week allows you to observe patterns in price behaviour on specific days.
Example of Practical Use
- Volatility Analysis : Helps traders identify days or periods with higher volatility based on the size of the candles.
- Daily Patterns : Processing candles from a specific day allows you to observe patterns of price behaviour on specific days.
- Decision Making : Provides quick visual insights into the strength of bullish and bearish movements, helping you make trading decisions.
Illustrative images
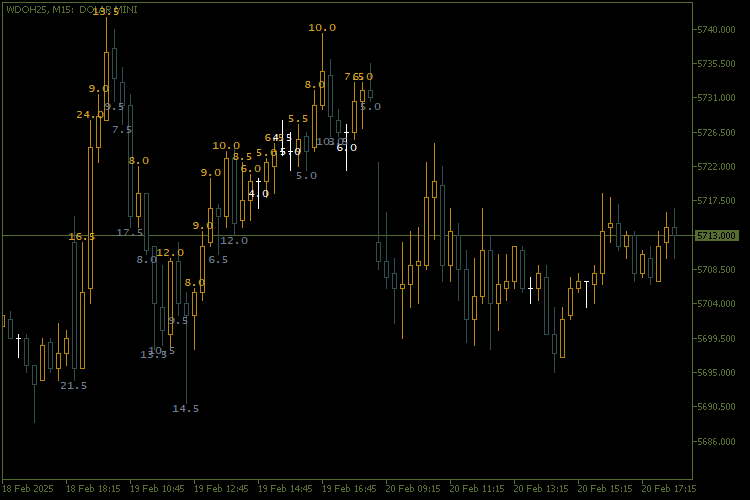
Figure 1: Example chart with the indicator applied. The colours differentiate bullish and bearish candles, while the text displays the size of each candle.
https://www.mql5.com/en/charts/20733290/wdoh25-m15-banco-btg-pactual


