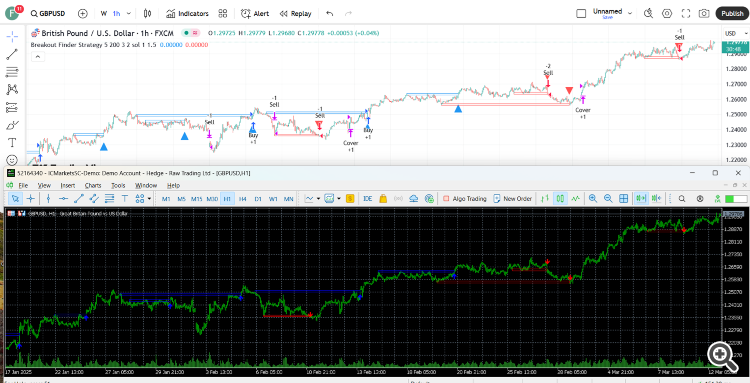
In order to download the compiled version you can follow this link.
This is doing calculations for all lookback bars every time a new bar is closed. In order not to do that you will need to have phval, phloc, plval and plloc as buffers. While the terminal does not manage complicated structures as buffers, you will have to do the buffer management all by yourself.
// This source code is subject to the terms of the Mozilla Public License 2.0 at https://mozilla.org/MPL/2.0/ // © LonesomeTheBlue //@version=4 study("Breakout Finder", "BF", overlay = true, max_bars_back = 500, max_lines_count = 400) prd = input(defval = 5, title="Period", minval = 2) bo_len = input(defval = 200, title="Max Breakout Length", minval = 30, maxval = 300) cwidthu = input(defval = 3., title = "Threshold Rate %", minval = 1., maxval = 10) / 100 mintest = input(defval = 2, title = "Minimum Number of Tests", minval = 1) bocolorup = input(defval = color.blue, title = "Breakout Colors", inline = "bocol") bocolordown = input(defval = color.red, title = "", inline = "bocol") lstyle = input(defval = line.style_solid, title = "Line Style", options = [line.style_solid, line.style_dashed, line.style_dotted]) //width lll = max(min(bar_index, 300), 1) float h_ = highest(lll) float l_ = lowest(lll) float chwidth = (h_ - l_) * cwidthu // check if PH/PL ph = pivothigh(prd, prd) pl = pivotlow(prd, prd) //keep Pivot Points and their locations in the arrays var phval = array.new_float(0) var phloc = array.new_int(0) var plval = array.new_float(0) var plloc = array.new_int(0) // keep PH/PL levels and locations if ph array.unshift(phval, ph) array.unshift(phloc, bar_index - prd) if array.size(phval) > 1 // cleanup old ones for x = array.size(phloc) - 1 to 1 if bar_index - array.get(phloc, x) > bo_len array.pop(phloc) array.pop(phval) if pl array.unshift(plval, pl) array.unshift(plloc, bar_index - prd) if array.size(plval) > 1 // cleanup old ones for x = array.size(plloc) - 1 to 1 if bar_index - array.get(plloc, x) > bo_len array.pop(plloc) array.pop(plval) // check bullish cup float bomax = na int bostart = bar_index num = 0 hgst = highest(prd)[1] if array.size(phval) >= mintest and close > open and close > hgst bomax := array.get(phval, 0) xx = 0 for x = 0 to array.size(phval) - 1 if array.get(phval, x) >= close break xx := x bomax := max(bomax, array.get(phval, x)) if xx >= mintest and open <= bomax for x = 0 to xx if array.get(phval, x) <= bomax and array.get(phval, x) >= bomax - chwidth num += 1 bostart := array.get(phloc, x) if num < mintest or hgst >= bomax bomax := na if not na(bomax) and num >= mintest line.new(x1 = bar_index, y1 = bomax, x2 = bostart, y2 = bomax, color = bocolorup, style = lstyle) line.new(x1 = bar_index, y1 = bomax - chwidth, x2 = bostart, y2 = bomax - chwidth, color = bocolorup, style = lstyle) line.new(x1 = bostart, y1 = bomax - chwidth, x2 = bostart, y2 = bomax, color = bocolorup, style = lstyle) line.new(x1 = bar_index, y1 = bomax - chwidth, x2 = bar_index, y2 = bomax, color = bocolorup, style = lstyle) plotshape(not na(bomax) and num >= mintest, location = location.belowbar, style = shape.triangleup, color = bocolorup, size = size.small) alertcondition(not na(bomax) and num >= mintest, title = "Breakout", message = "Breakout") // check bearish cup float bomin = na bostart := bar_index num1 = 0 lwst = lowest(prd)[1] if array.size(plval) >= mintest and close < open and close < lwst bomin := array.get(plval, 0) xx = 0 for x = 0 to array.size(plval) - 1 if array.get(plval, x) <= close break xx := x bomin := min(bomin, array.get(plval, x)) if xx >= mintest and open >= bomin for x = 0 to xx if array.get(plval, x) >= bomin and array.get(plval, x) <= bomin + chwidth num1 += 1 bostart := array.get(plloc, x) if num1 < mintest or lwst <= bomin bomin := na if not na(bomin) and num1 >= mintest line.new(x1 = bar_index, y1 = bomin, x2 = bostart, y2 = bomin, color = bocolordown, style = lstyle) line.new(x1 = bar_index, y1 = bomin + chwidth, x2 = bostart, y2 = bomin + chwidth, color = bocolordown, style = lstyle) line.new(x1 = bostart, y1 = bomin + chwidth, x2 = bostart, y2 = bomin, color = bocolordown, style = lstyle) line.new(x1 = bar_index, y1 = bomin + chwidth, x2 = bar_index, y2 = bomin, color = bocolordown, style = lstyle) plotshape(not na(bomin) and num1 >= mintest, location = location.abovebar, style = shape.triangledown, color = bocolordown, size = size.small) alertcondition(not na(bomin) and num1 >= mintest, title = "Breakdown", message = "Breakdown") alertcondition((not na(bomax) and num >= mintest) or (not na(bomin) and num1 >= mintest), title = "Breakout or Breakdown", message = "Breakout or Breakdown")


