
Discover expert developed MetaTrader tools that can complement professional solutions.
Market Watch Mini Scanner: RSI Overbought/Oversold Across Symbols
The idea behind it
The Relative Strength Index (RSI) measures the speed and size of recent price changes on a scale from 0 to 100. Values above 70 are traditionally read as overbought, values below 30 as oversold. Checking the RSI of many symbols by opening one chart after another is slow. This indicator does it in one place: it creates an RSI for every symbol of the Market Watch (or for a list you enter), reads the values at a regular interval and shows them in a small panel in the corner of the chart.
The panel answers three questions at a glance: which symbols are currently stretched, in which direction, and how far. The symbols can be sorted so that the most extreme ones are at the top, or filtered so that only overbought and oversold symbols are shown. The scanner can be attached to any chart; the symbol of that chart does not matter.
Capture price channel breakouts with the Price Channel Expert Advisor. Precise entries and exits. Explore now.
How to interpret it
- Symbol – the scanned symbol.
- RSI – the RSI value of the symbol on the selected timeframe (the last closed bar by default).
- Gauge – a horizontal bar whose length is proportional to the RSI (full length = 100). Its color shows the status.
- Status – Overbought when the RSI is at or above InpOverbought, Oversold when it is at or below InpOversold, otherwise Neutral. Default colors: overbought red, oversold green, neutral gray. n/a means that no data is available yet for that symbol.
- Order of the rows – depends on InpSort: as in the source list, highest RSI first, lowest RSI first, or the most extreme first (largest distance from 50). Symbols without data are placed at the end.
- Title – shows the timeframe and the period of the RSI.
- Alerts (optional) – a message is shown (and optionally sent as a push notification or e-mail) when a symbol changes from neutral into the overbought or oversold zone.
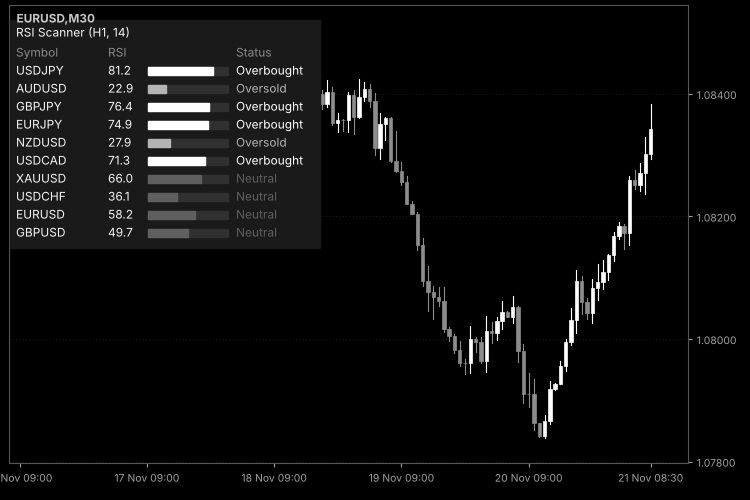
Fig. 1. RSI scanner with ten symbols sorted by the distance of the RSI from 50: overbought and oversold symbols on top; black & white image per Code Base image guidelines (colors are configurable).
External variables (inputs)
| Input | Default | Purpose |
|---|---|---|
| InpSource | SCAN_MARKET_WATCH | Source of the symbols: the symbols shown in the Market Watch, or the custom list InpSymbols. |
| InpSymbols | "EURUSD,GBPUSD,USDJPY,AUDUSD,XAUUSD" | Symbols separated by commas; used when InpSource is SCAN_CUSTOM_LIST. Symbols that do not exist are skipped. |
| InpMaxSymbols | 20 | Maximum number of symbols scanned and shown (1–50). |
| InpTimeframe | PERIOD_H1 | Timeframe of the RSI (PERIOD_CURRENT = chart timeframe). |
| InpRSIPeriod | 14 | Period of the RSI (2 or more). |
| InpOverbought | 70.0 | Overbought level; must be greater than the oversold level and not above 100. |
| InpOversold | 30.0 | Oversold level; must be greater than 0. |
| InpUseClosedBar | true | true: RSI of the last closed bar (stable); false: RSI of the forming bar (changes with every tick). |
| InpSort | SORT_EXTREME | Order of the rows: SORT_NONE, SORT_RSI_DESC, SORT_RSI_ASC or SORT_EXTREME. |
| InpOnlyExtremes | false | Shows only the overbought and oversold symbols. |
| InpRefreshSeconds | 5 | Refresh interval of the scan in seconds (1–3600). |
| InpEnableAlerts | false | Shows an alert when a symbol becomes overbought or oversold. |
| InpAlertPush | false | Also sends a push notification (requires InpEnableAlerts). |
| InpAlertEmail | false | Also sends an e-mail (requires InpEnableAlerts). |
| InpShowTitle | true | Shows the title row. |
| InpX | 10 | Distance of the dashboard from the left chart edge, in pixels. |
| InpY | 20 | Distance of the dashboard from the top chart edge, in pixels. |
| InpFontSize | 9 | Font size (7–14); the whole dashboard scales with it. |
| InpBackColor | C'20,24,32' | Background color of the panel. |
| InpTextColor | clrWhiteSmoke | Color of the symbol names and values. |
| InpColorOB | clrTomato | Color of the overbought status and gauge. |
| InpColorOS | clrLimeGreen | Color of the oversold status and gauge. |
| InpColorNeutral | clrGray | Color of the neutral status and gauge. |
Recommended use
- Symbols: in the Market Watch mode the list is taken when the indicator starts. After you add or remove symbols in the Market Watch, reload the indicator (or change one of its inputs). The scanner creates one RSI handle per symbol, so keep InpMaxSymbols reasonable; the default 20 is fine for most terminals. If your broker uses prefixes or suffixes, use the custom list with the exact symbol names.
- Timeframes: the RSI timeframe is independent of the chart. A higher timeframe (H1–D1) gives fewer and more significant signals; a lower one gives more frequent signals.
- Closed or forming bar: with the closed-bar mode the status of a symbol changes only when a new bar of the RSI timeframe is completed, so alerts do not flicker. The forming-bar mode reacts faster, but a symbol can enter and leave the zone before the bar closes.
- Refresh: the dashboard is refreshed by a timer, so it also works when the symbol of the chart has no ticks (for example, on a weekend chart of another market). It is refreshed as well on the first call and on every new bar of the chart.
- First start: the terminal has to calculate the RSI for every symbol and may need to load its history; until then a symbol shows "--" and "n/a". Alerts are not sent for the first readings.
- Caveats: overbought does not mean "sell" and oversold does not mean "buy": in strong trends the RSI can stay in an extreme zone for a long time. The scanner shows where to look, not what to do; use it with your own entry rules and risk management.
- Efficiency: there is no price history to recalculate; each refresh reads one value per symbol from the RSI handles. The panel objects are created once and only their texts, colors and sizes are updated.
- Account types: the indicator does not trade and works identically on netting and hedging accounts.
- All objects of the panel carry a unique prefix and are removed, the timer is stopped and the indicator handles are released, when the indicator is deleted or reinitialized.
Complement community code with advanced automation from RobotFX.
79907


