
Explore the latest free tools from the MQL5 community. Here's a new indicator, expert advisor, or script for MetaTrader.
Most panels show the balance. This one shows what the account is going through right now: how far the equity is from its peak, how deep it has been, what was closed today, this week and this month, and which Expert Advisor is carrying the open result.
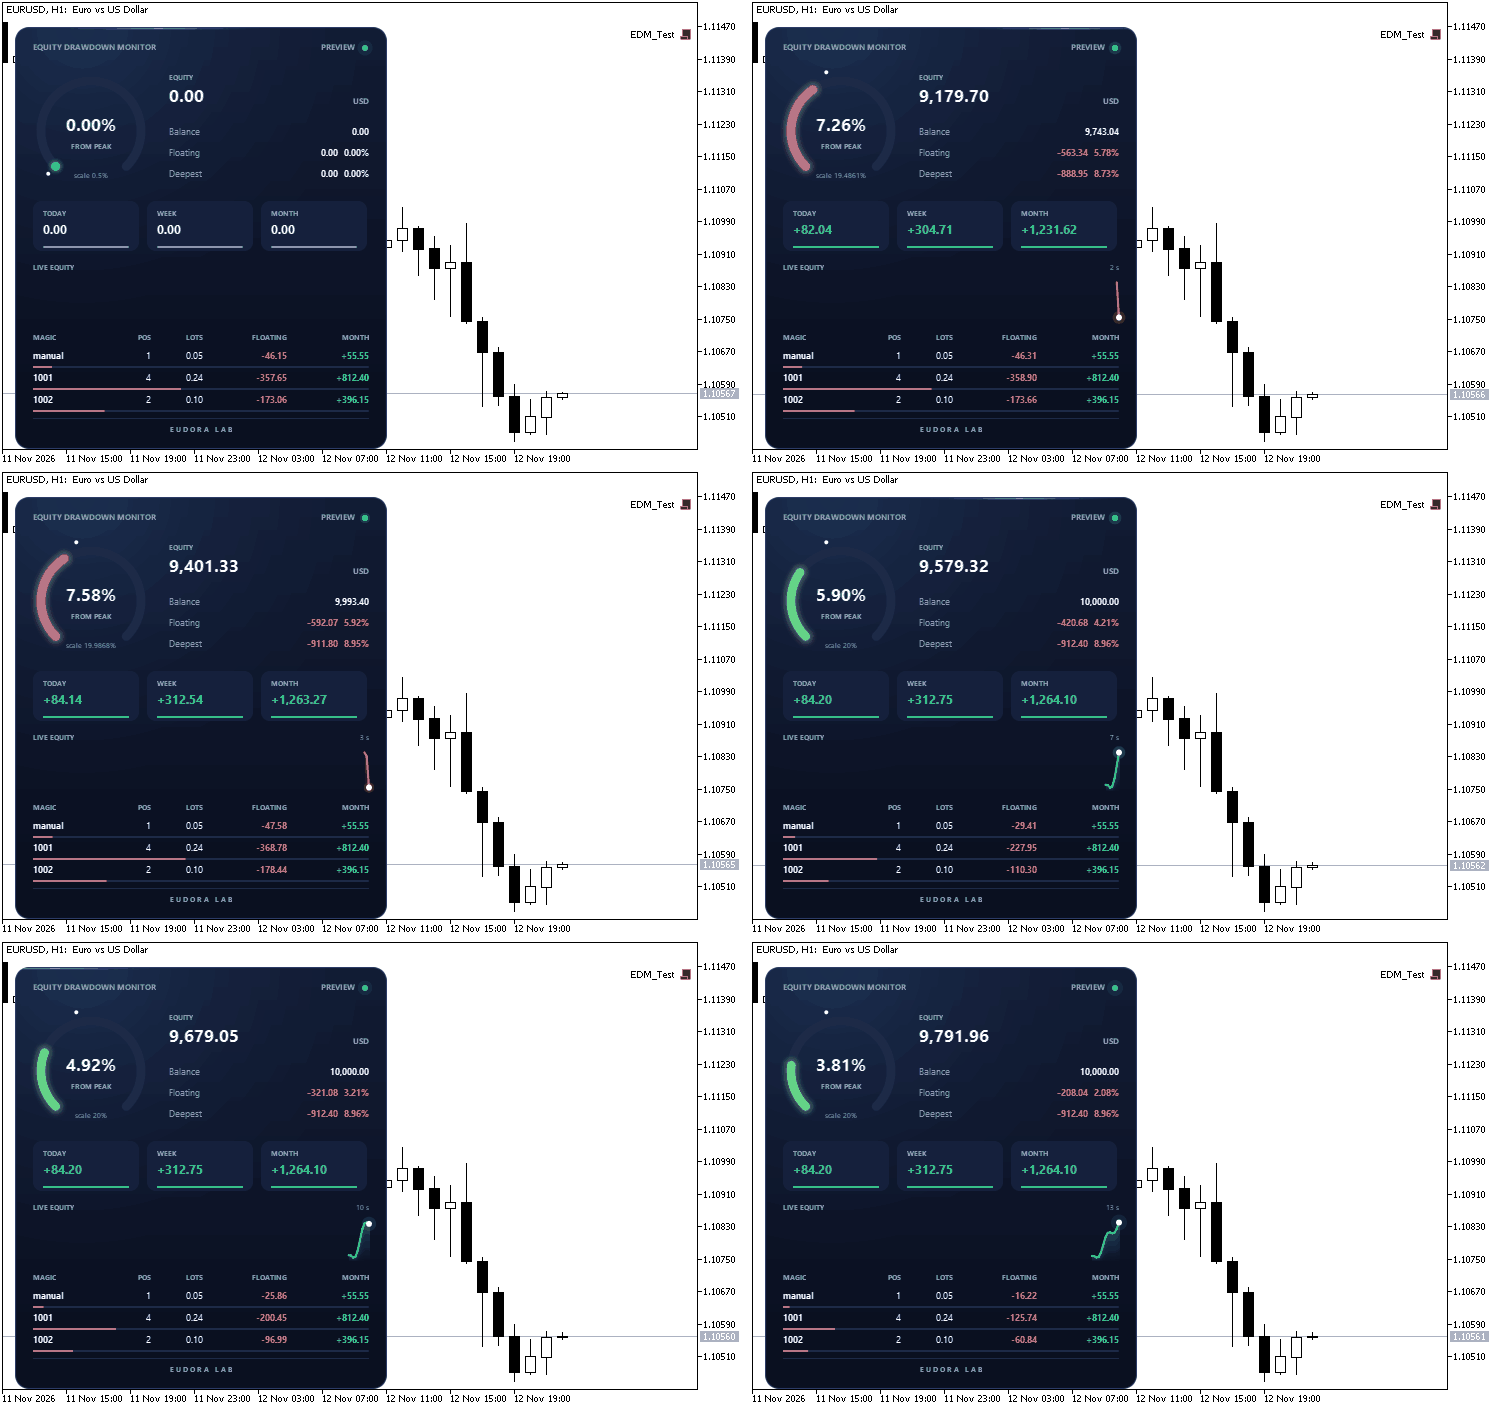
The panel at work in preview mode, with sample data
Smooth out market noise with the Heiken Ashi Expert Advisor for MT4 and MT5. Reliable trend-following automation. Details here.
The panel is drawn on a canvas with antialiased shapes and smooth transitions. The gauge sweeps to its value, the figures count up and down as the account moves, and the equity line updates every second. The indicator is read-only: it reads account data and draws the panel, all inside the terminal. The code is a single file and uses only the standard Canvas library.
What the panel shows
- Gauge: the drawdown from the equity peak, as a percentage. The arc turns from green to amber to red as it fills. The small white dot on the rim marks the deepest drawdown recorded so far.
- Account: equity, balance, the floating result in money and as a percentage of the balance, and the deepest drawdown from peak.
- Closed result: today, this week (from Monday) and this month, in server time. Swap, commission and fee are included.
- Live equity: the equity of the last two and a half minutes, one sample per second.
- One line per magic number: open positions, total lots, floating result and closed result of the month. Manual trades are listed as "manual". The bar under each line shows its weight against the others.
How the peak works
The peak starts from the equity at the moment the indicator is first attached, and it rises every time the equity makes a new high. It is stored in the global variables of the terminal, one set per account, so it survives restarts and timeframe changes. Deposits and withdrawals move the peak by the same amount, so a withdrawal is counted as a transfer and the drawdown figure stays clean.
Inputs
- Distance from the left edge / top edge: position of the panel on the chart, in pixels.
- Panel size, percent: scales the whole panel; it also follows the DPI of the screen.
- Lines in the magic number table: how many magic numbers are listed (default 6).
- Accent color: the color of the light on the panel.
- Full scale of the gauge, %: 0 lets the gauge choose a round scale above the deepest drawdown seen.
- Alert when drawdown from peak reaches, %: 0 turns the alert off.
- Restart the peak from the current equity: set to true once, then back to false.
- Preview with sample data: shows the panel at work before the first trade. The screenshot below was taken in this mode.
Works on any symbol and timeframe, on hedging and netting accounts.
Complement community code with advanced automation from RobotFX.
79482


