
Discover expert developed MetaTrader tools that can complement professional solutions.
Each cell is the rolling Pearson correlation coefficient between two symbols in your basket, computed from closed-bar returns over a fixed lookback window. The matrix recalculates once per new bar — not on every tick — so it stays cheap to run and doesn't fight the terminal for CPU on a busy multi-chart setup.
How to interpret it
- Each row and column header is a symbol from your basket, in the order you listed them.
- Each off-diagonal cell holds the correlation coefficient (–1.00 to 1.00) between that row's symbol and that column's symbol over the lookback window.
- The diagonal is always "--" — a symbol against itself is a trivial 1.00 and adds nothing.
- Cell shading grades from gray (near zero, no real relationship) toward green as the pair moves together, and toward red as it moves inversely — the color is a faster read than the number alone.
- The grid is symmetric (row/column swapped gives the same value), which is expected — it's a visual confirmation the math is behaving, not a bug to fix.
- With alerts on, a crossing of your threshold prints to the Experts log and fires a terminal Alert() once, then re-arms only after the pair drops a defined margin back below the threshold — so a reading sitting right on the line doesn't spam you every bar.
External variables (inputs)
| Input | Default | Purpose |
|---|---|---|
| InpSymbolList | EURUSD,GBPUSD,USDJPY,XAUUSD | Comma-separated basket to correlate. Any symbol not found in the terminal is skipped with a log warning rather than failing the whole indicator. |
| InpTimeframe | PERIOD_CURRENT | Timeframe the return series is built from — independent of whatever timeframe the chart itself is showing. |
| InpLookbackBars | 100 | Rolling window length, in closed bars, used for every pairwise correlation. |
| InpRecalcEveryN | 1 | Recalculate every N new bars instead of every single one — set above 1 to lighten the load on a very large basket. |
| InpAlertOnThreshold | false | Enable a one-shot alert when any pair's |correlation| crosses InpAlertThreshold. |
| InpAlertThreshold | 0.80 | |r| level that triggers the alert. |
| InpAlertHysteresis | 0.05 | How far |r| must fall back below the threshold before that pair can alert again — stops repeat firing right at the boundary. |
| InpCornerX | 20 | Panel X offset in pixels from the chart's top-left corner. |
| InpCornerY | 20 | Panel Y offset in pixels from the chart's top-left corner. |
| InpCellSize | 55 | Width and height of each grid cell, in pixels. |
| InpLabelCol | 90 | Width reserved for the row-label column so longer symbol names don't get clipped. |
Recommended use
- Works on any symbol combination the broker exposes — FX, metals, crypto CFDs, indices — as long as each name resolves via Market Watch.
- Daily or H4 bars give the most stable, meaningful correlation reading; M1/M5 will be noisy and will flip sign more than the underlying relationship actually does.
- Pure visualization — it places no orders and holds no position, so it carries none of its own margin or stop-out risk and runs the same on any account type.
- A basket larger than six or seven symbols gets visually cramped fast — the grid scales as the square of the basket size, so widen InpCellSize or split into two charts rather than one giant matrix.
- Correlation computed from returns, not raw price, so it reads relationship-of-movement, not relative price level — two symbols at very different price scales still compare correctly.
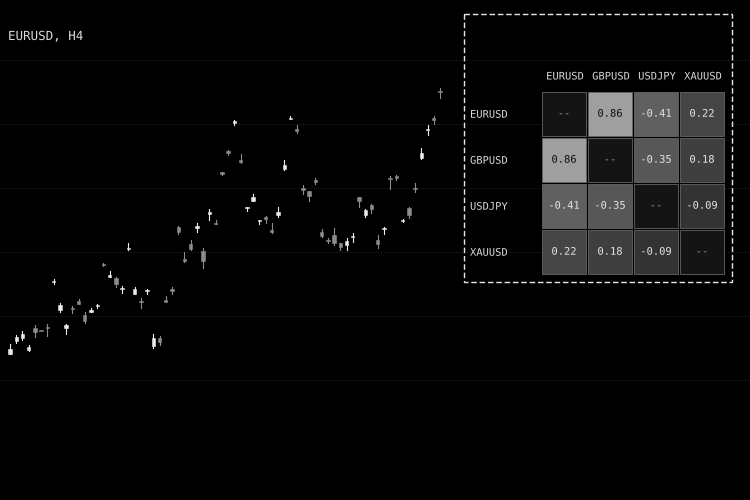
Fig. 1. Correlation Matrix Dashboard panel on an EURUSD chart (shown in black & white per Code Base image guidelines; on a live chart the grid is color-graded red-to-green).
Trade the powerful Traders Dynamic Index strategy automatically with this dedicated TDI Expert Advisor. More details.
Build better strategies with RobotFX professional tools – check them out.
79481


