
RobotFX curates the best open-source MetaTrader code to inspire your trading automation.
RealizedVol.mqh measures and forecasts volatility from prices. It has five estimators on OHLC bars (close to close, Parkinson, Garman-Klass, Rogers-Satchell and Yang-Zhang), the daily realized variance, bipower variation and realized quarticity from intraday bars (the bipower variation is the part of the variance without jumps), and the HAR model of Corsi (2009), the usual benchmark for forecasting realized volatility, with Newey-West standard errors. No DLL.
Usage
#include <RealizedVol\RealizedVol.mqh>

MqlRates d1[], m5[];
CopyRates(_Symbol, PERIOD_D1, 1, 21, d1);
CopyRates(_Symbol, PERIOD_M5, 1, 300 * 288, m5);
double yz = CRangeVolatility::Estimate(d1, 20, 20, RV_YANG_ZHANG);   // variance per day over the last 20 days
double vol = 100.0 * MathSqrt(yz * 252);                              // % a year
datetime days[];
vector rv, bv, rq;
int counts[];
CRealized::Daily(m5, days, rv, bv, rq, counts);                       // realized and bipower variance per day
CHar har;
if(har.Fit(rv, 5, true))                                              // HAR on log realized variance, 5 days ahead
  {
   double week = 100.0 * MathSqrt(har.Forecast() * 252);              // volatility expected over the next 5 days
  }
What is in it
- CRangeVolatility: Estimate() over any window of bars, Rolling() for every bar. The range estimators use the high and low of each bar and need 5 to 8 times fewer bars than close to close for the same precision; Rogers-Satchell is right with a drift, Yang-Zhang also counts the gaps between bars (weekend, overnight).
- CRealized::Daily: one value per day from intraday bars, with the returns inside each day only (the gap from the day before is left out), a shift for the start of the day and a minimum number of bars. Jump() gives the part of the variance above the bipower variation.
- CHar: the average realized variance of the next 1, 5 or 22 days regressed on the last day and the averages of the last 5 and 22 days, in levels or logs, with Newey-West standard errors, R squared and the forecast.
Example
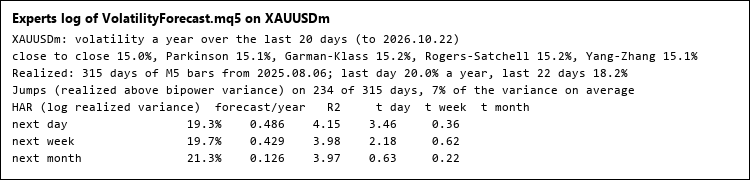
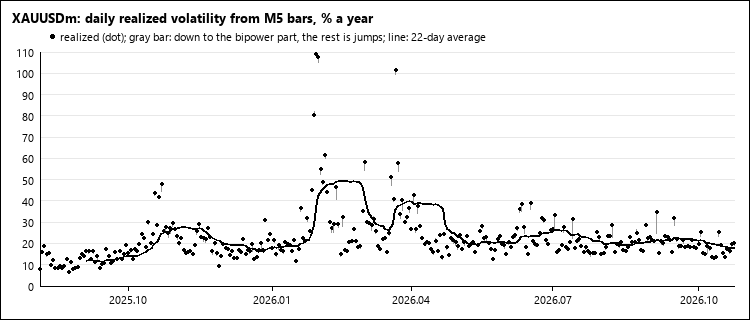
The script VolatilityForecast.mq5 prints the volatility of a symbol over the last 20 days by the five estimators, its realized volatility from M5 bars (last day and last 22 days), how much of it comes from jumps, and the HAR forecasts for the next day, week and month with their t statistics (picture 1). It can write the daily realized and bipower variances to a CSV file (picture 2).
Protect profits effectively with the smart Trailing Stop Expert Advisor. Advanced trailing options for MT4/MT5. See it in action.
Checked
- the five estimators with windows of 10, 20 and 60 bars on BTCUSDT D1 and XAUUSD H1 against an independent pandas version: within 4e-12;
- the daily realized variance, bipower variation and quarticity of 1 359 days from 391 271 M5 bars of BTCUSDT against pandas: the same days and counts, values within 2e-12 (4 ms for all the bars);
- 6 HAR fits (horizons 1, 5 and 22, levels and logs) against statsmodels OLS with HAC covariance: coefficients, standard errors, R squared and forecasts within 2e-12.
Files
RealizedVol.mqh goes to MQL5\Include\RealizedVol, VolatilityForecast.mq5 to MQL5\Scripts\RealizedVol.
Thanks for reading. Discover premium MetaTrader solutions at RobotFX.
78861


