
Fresh MQL5 code release – perfect for enhancing your MT4/MT5 strategies.
Overview
This is a faithful MetaTrader 5 port of the Relative Moving Average (RMA) framework introduced by Dr. Daniel Alexandre Bloch in A Course on Systematic Trading with RMA. A classical moving average reduces a window of prices to one smoothed number, which tells you the level but not the rarity: a high close may be far from everything around it, or high and yet perfectly ordinary within the window. The RMA answers the second question. It treats the trailing window as a small distribution, ranks the current price inside it, and reports that rank on a [0, 1] scale that means the same thing on every instrument and in every volatility regime.
The framework has three layers, and the code mirrors them exactly:
- The SMA of the trailing window of W closes, treated as the local equilibrium and fixed at zero.
- The RMA family, the deviation of each window landmark from that equilibrium as the pure ratio sma / x - 1, evaluated at the last close, the first close, the middle close, and the window minimum and maximum. Being ratios, they are scale free and comparable across symbols.
- The fractiles, which re-express the window as normalised returns (close / sma - 1) and rank the current, minimum and maximum members inside that distribution. This is the plain empirical CDF, taken verbatim from the paper's appendix definition, and f_w is the series everything downstream actually trades on.

Protect profits effectively with the smart Trailing Stop Expert Advisor. Advanced trailing options for MT4/MT5. See it in action.
The construction: a sliding window of closes becomes an SMA, the closes are re-expressed as a distribution of normalised returns about that SMA, and the current price's rank inside that distribution becomes its fractile on the [0, 1] scale.
On top of those, two derived readings ship with the engine. A regime detector classifies the spread of normalised returns as expanding, contracting, or in transition, using the paper's Relative Extremum Ratios corroborated by a least-squares slope, a z-score, and a coefficient of variation. An adverse-movement monitor publishes d_med_w, the fractile re-centred on the median, and D_k, the share of recent bar-to-bar steps in it that were upward, which is a directional-consistency reading that makes "this move is going the other way" precise rather than a matter of opinion.
Two programs are included. RMA_Engine computes every series and publishes all nineteen of them as buffers, so an Expert Advisor or another indicator can read the exact numbers on the chart rather than reimplementing the mathematics and drifting out of step. RMA_Panel computes nothing at all: it locates the engine already attached to the chart and mirrors a group of its buffers into a sub-window of their own, because the rma family is measured in fractions of a percent and d_med_w is centred on zero, so neither is readable on the engine's 0-to-1 axis.
What the Engine Draws
The engine opens a separate window with its vertical axis pinned to [0, 1] and draws six plots:
|
Plot |
Appearance |
What it says |
|---|---|---|
|
Regime |
Full-height coloured band behind everything |
Green for expansion, red for contraction, amber for expansion rolling over, blue for contraction breaking out. Nothing is drawn while the regime is still undecided, so a warmup does not open with a wash of colour that means "no answer yet". |
|
f_w |
Thick blue line |
The current close's fractile: where the latest normalised return ranks inside its own window. This is the primary series. |
|
f_min / f_max |
Dotted red and green |
The fractiles of the window minimum and maximum, the floor and ceiling of the envelope f_w traverses. |
|
alpha_lo_mean / alpha_hi_mean |
Purple and orange lines |
Smoothed quantile levels: an EMA of f_w and of its complement, giving the slower backdrop against which a spike in f_w reads as a spike. |
Three horizontal guides are drawn at the two entry thresholds and at the median. They are built from the same inputs the companion Expert Advisor is given rather than hard coded, so retuning the thresholds moves the guides with them instead of leaving the chart quietly disagreeing with the rules.
How to read it. An f_w pressed against the upper guide means the current close is at the top of everything its window has seen, which is where a downward traversal arms; an f_w at the lower guide is the mirror case. The median is the level a traversal has to still be on the right side of, and crossing it is the natural exit. The coloured band gives that reading its context, since the paper's rhythm is to open trades at the onset of an expansion phase and close them during contraction.
Recommended Setup
|
Setting |
Recommended value |
Notes |
|---|---|---|
|
Symbol |
Any |
The fractile scale is self-normalising, so no per-symbol calibration is needed for the reading to be meaningful. Development and the screenshots below used EURUSD. |
|
Timeframe |
M30 to H4 |
Works on any timeframe. The window is measured in bars, so a shorter timeframe with the same W simply describes a shorter stretch of market. |
|
Window size (W) |
106 bars |
The default. The paper intends the window to be calibrated per asset, so this is a starting point rather than a recommendation. |
|
History required |
W + regime lookback bars |
126 bars with the defaults. Each plot begins where its own module can first answer rather than at the longest warmup of the set, so the fractiles appear before the regime band does. |
Key Features
Faithful to the paper
- The fractile is the paper's appendix definition, f_i = (1 / |W_i|) * sum_j I( W_ij <= v_i ), implemented as written. Where the paper's prose and its appendix disagree, the appendix wins and the discrepancy is documented in the source rather than silently patched.
- The regime classification follows the Relative Extremum Ratios, testing contraction first because it is the strictest reading and requires corroboration, while expansion is deliberately easier to reach.
- No smoothing, thresholds, or filters were added that the source does not call for.
Built to be read by other programs
- All nineteen series are exposed as indicator buffers, six plotted and thirteen calculation only, so an EA can read the same numbers the chart shows and the two can never disagree.
- The buffer map lives in a single shared header, so the engine, the panels, and any consumer speak one vocabulary instead of drifting apart with no compile error to warn anyone.
- The mathematics lives entirely in header-only classes with no dependency on charts or orders, so the same code can drive a script or a test harness with nothing stubbed.
Correct incremental recalculation
- Each pass recomputes from prev_calculated-1, not prev_calculated. The bar at that index was still forming on the previous call and its close only became final now; leaving it alone would freeze a half-formed value into every series that depends on it, and the bar-to-bar fractile difference would become a difference between two unfinished numbers.
- Warmup bars carry EMPTY_VALUE rather than zero, so a consumer arriving mid-warmup sees "absent" instead of a plausible number.
- The regime classification is path dependent inside its transition band, so a per-bar history is kept rather than one running field, which is what lets an incremental pass pick the chain back up from the bar before.
Panels that borrow a second axis
- The engine opens the panels it was asked for automatically, checking the chart first so a template that already carries them, or a reinitialisation after an input change, does not stack a second copy behind the first. Panels are removed with the engine, but only on actual removal, so switching timeframe returns you to the layout you left.
- The panel finds the engine by matching its short name on the chart instead of building its own handle, so it can never fork into a second, differently parameterised calculation drawn beside the real one.
Screenshots
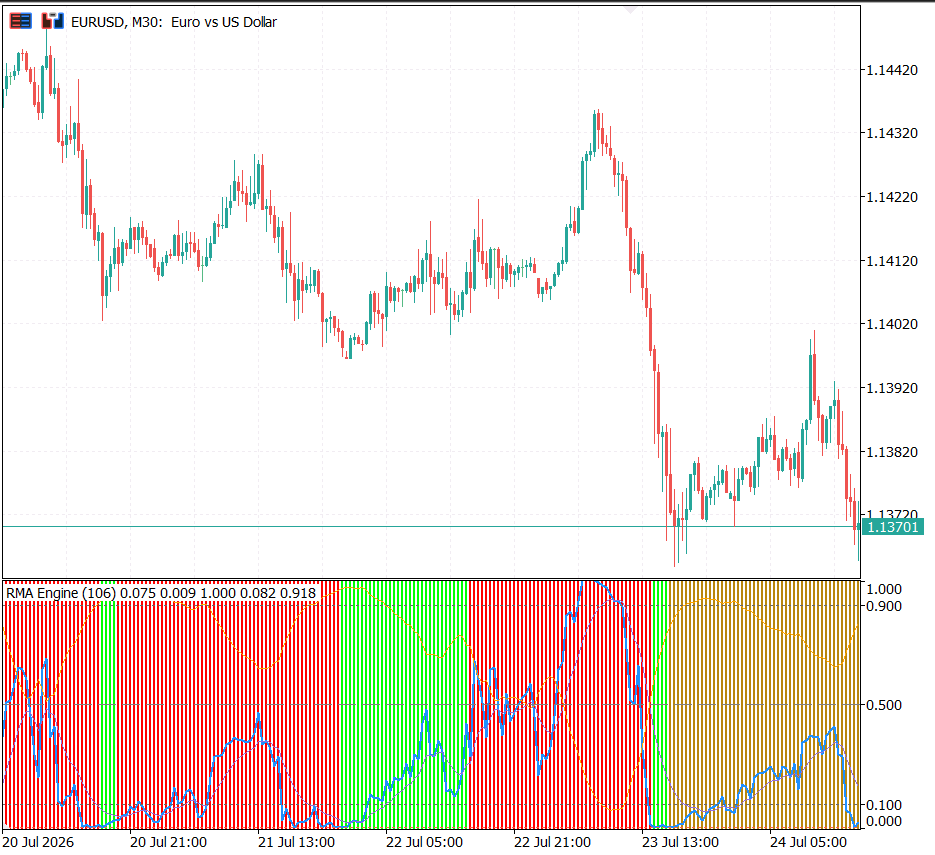
The engine window on EURUSD, M30: f_w with its envelope and the smoothed quantile means, over the coloured regime backdrop.
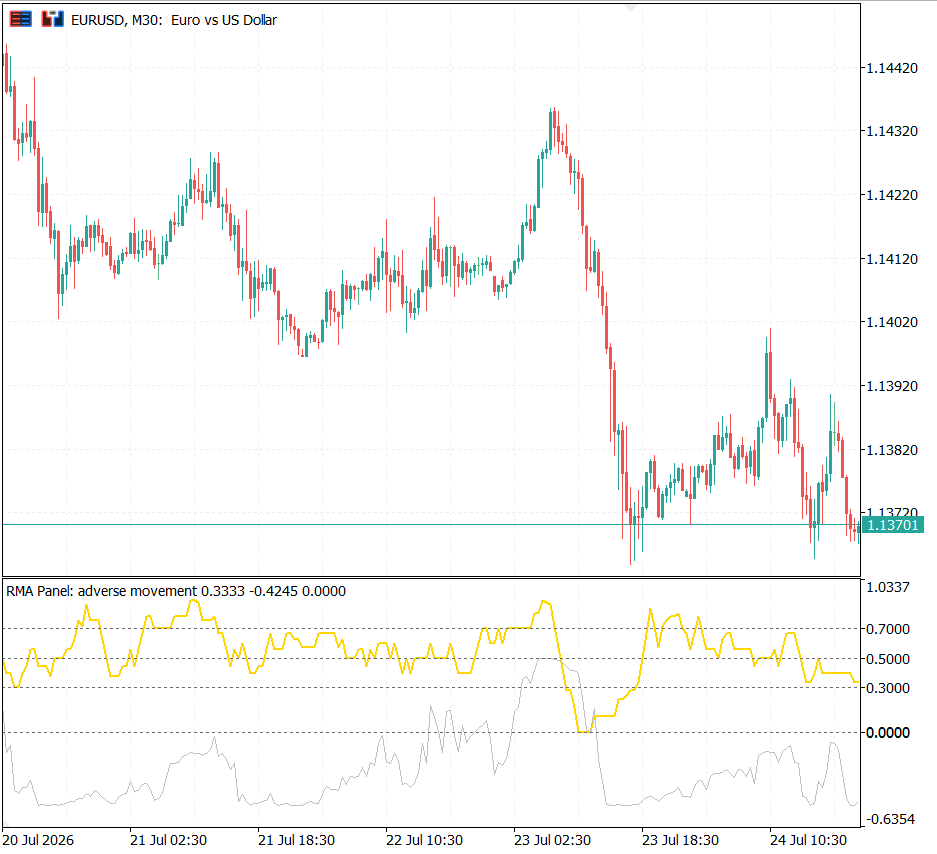
The adverse panel: d_med_w centred on zero with D_k above it, the directional-consistency reading.
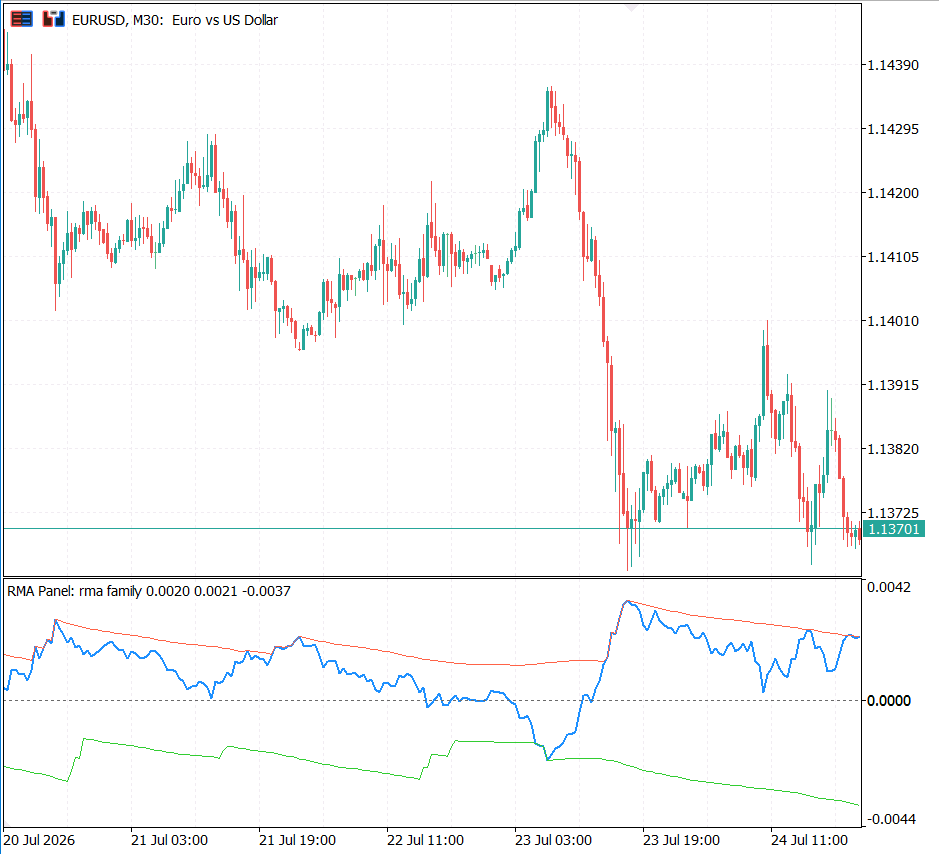
The RMA family panel: rma_w with the window minimum and maximum on their own scale, the envelope the current price traverses.
Installation and File Structure
Two indicators and four header files. The layout matters: the engine loads the panel by the relative path RMA\RMA_Panel, and the headers are included as <RMA\...>, so both must sit in their RMA subfolders.
|
File |
Role |
Description |
|---|---|---|
|
Indicators\RMA\RMA_Engine.mq5 |
Main indicator |
Runs the three modules on live bars, binds all nineteen buffers, draws the six plots and the regime band, and opens the panels. Holds no mathematics of its own. |
|
Indicators\RMA\RMA_Panel.mq5 |
Passthrough panel |
Locates the engine on the chart and mirrors one group of its buffers into a sub-window with its own scale. Two modes: adverse movement (D_k, d_med_w) and the rma family (rma_w, rma_min, rma_max). |
|
Include\RMA\RmaTypes.mqh |
Shared vocabulary |
The regime and cross-state enumerations, the buffer map, and the plot and palette counts. The one place the engine, the panels and any consumer agree. |
|
Include\RMA\RmaCore.mqh |
Numerical core |
The SMA, the five-member RMA family, the normalised-return distribution, the fractile function, the window range, and the smoothed alpha bounds. |
|
Include\RMA\RegimeDetector.mqh |
Regime classification | Expansion, contraction and the two transition states, from the extremum-ratio envelope corroborated by slope, z-score and coefficient of variation. |
|
Include\RMA\AdverseMonitor.mqh |
Directional consistency |
d_med_w, the median-centred fractile, and D_k, the upward share of its recent bar-to-bar steps. |
Reading the Buffers from Your Own Code
Acquire a handle with iCustom on RMA\RMA_Engine and read any index below with CopyBuffer. Indices 0 to 6 are the plotted series and 7 to 18 are calculation only, but all nineteen are readable.
|
Index |
Series |
Meaning |
|---|---|---|
|
0, 1 |
Regime band, colour index |
The backdrop's height and its palette slot. Carries no measurement, only a colour. |
|
2 |
f_w |
Fractile of the window's last normalised return, in [0, 1]. The primary series. |
|
3, 4 |
f_min, f_max |
Fractiles of the window minimum and maximum. |
|
5, 6 |
alpha_lo_mean, alpha_hi_mean |
EMA of the lower and upper alpha bounds. |
|
7 |
sma |
The window's simple moving average, in price units. |
|
8 to 12 |
rma_w, rma_1, rma_mid, rma_min, rma_max |
The RMA family: sma divided by the last, first, middle, minimum and maximum close, minus one. |
|
13 |
range |
Spread of the window's normalised returns, the quantity the regime detector reads. |
|
14, 15 |
alpha_lo, alpha_hi |
The raw quantile level f_w occupies, and its complement. |
|
16 |
regime |
The regime enumeration as a double: 0 expansion, 1 contraction, 2 rolling over, 3 breaking out, 4 unknown. |
|
17, 18 |
D_k, d_med_w |
Directional consistency and the median-centred fractile. |
Input Parameters
|
Group |
Parameters |
Defaults |
|---|---|---|
|
Window |
InpWindowSize, InpSmoothingPeriod |
106 bars, 10 |
|
Regime detection |
InpEpsilonLow, InpEpsilonHigh, InpSlopeThreshold, InpRegimeLookback, InpVariationRatioLow, InpZScoreExpansion, InpRangeHistoryLookback |
0.15, 3.0, 0.0001, 20, 0.1, 1.0, 100 |
|
Adverse movement |
InpAdverseLookback |
10 bars |
|
Reference lines |
InpEntryUpperThreshold, InpEntryLowerThreshold |
0.9, 0.1 |
|
Panels |
InpAutoAttachPanels, InpPanelAdverse, InpPanelRmaValues, InpAdverseThresholdDown, InpAdverseThresholdUp |
true, true, false, 0.3, 0.7 |
|
Regime backdrop |
InpShowRegimeBand plus one colour per regime | true, dark green / red / amber / blue |
Research Basis
The implementation follows:
- Daniel Alexandre Bloch, A Course on Systematic Trading with RMA, available on SSRN.
One caveat is worth stating plainly, because it comes from the source itself: the paper's Results section is left as future work. It offers a framework and its mechanics, not an empirical track record. What this indicator gives you is a described market state on a scale that means the same thing everywhere, which is a foundation for your own testing rather than a validated edge inherited from the source.
A companion article walks through the mathematics and the implementation of every module, and builds the Expert Advisor that trades on these buffers: Bloch's Relative Moving Average (RMA) Framework Implementation In MQL5.
Thanks for reading. Discover premium MetaTrader solutions at RobotFX.
75472


