
New free code from MQL5: indicators, EAs, and scripts for traders.
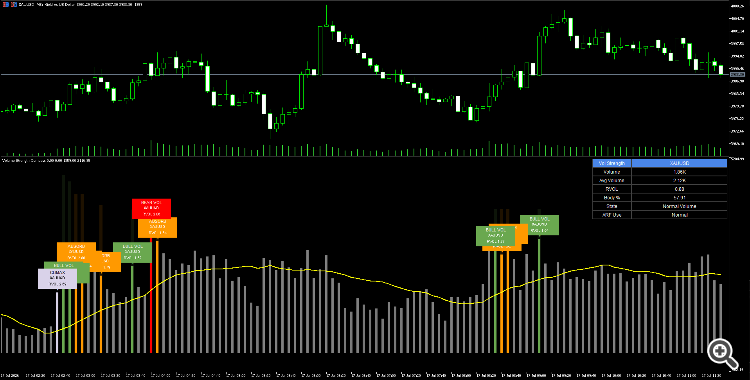
This indicator is used to understand how much market activity is behind each candle and whether that activity produced a meaningful bullish or bearish result.
Trade Renko charts automatically using the advanced Renko Expert Advisors. Clean trends, better entries. Discover them here.
It helps traders distinguish between:
- normal market activity
- unusually high or low volume
- strong bullish participation
- strong bearish participation
- climax volume
- absorption, where volume is high but price movement is weak
For example, a large bullish candle with high relative volume may indicate genuine buying pressure, while a small candle with very high volume may suggest absorption or a possible turning point.
It is especially helpful for:
- Price-action traders, who want volume confirmation before entering.
- Breakout traders, who want to check whether a breakout has strong participation.
- Reversal traders, who look for climax or absorption near support and resistance.
- Intraday traders and scalpers, who need quick information about current market strength.
- Forex and CFD traders, who mainly use tick volume in MetaTrader.
- Crypto, stock, and futures traders, where real volume may be available.
- Beginner traders, because the dashboard translates raw volume data into simple states such as Bull Good Volume, Bear Good Volume, Climax, or Absorption.
The indicator is best used as a confirmation tool, not as a complete trading strategy by itself. Entries should still be combined with trend direction, support and resistance, market structure, or another entry method.
Thanks for reading. Discover premium MetaTrader solutions at RobotFX.
75081


