
Discover expert developed MetaTrader tools that can complement professional solutions.
In his book “Mastering Elliot Wave”, Glenn Neely described a new approach to Elliot wave analysis. This technique is known as Neely Method and it is a more objective approach to market wave analysis.
The basic unit in this theory is called a Monowave and it is simply the movement of the price until it changes direction. Monowaves can be identified by plotting the high and low prices for a chosen period according to the order of appearance on beginning and the center of the time slot.
Classic MACD strategy made fully automatic – the MACD Expert Advisor for MT4 handles it all. Check it out.
There are many levels for this concept and they have different names such as: Monowave, PolyWave, Multiwave, and Macrowave.
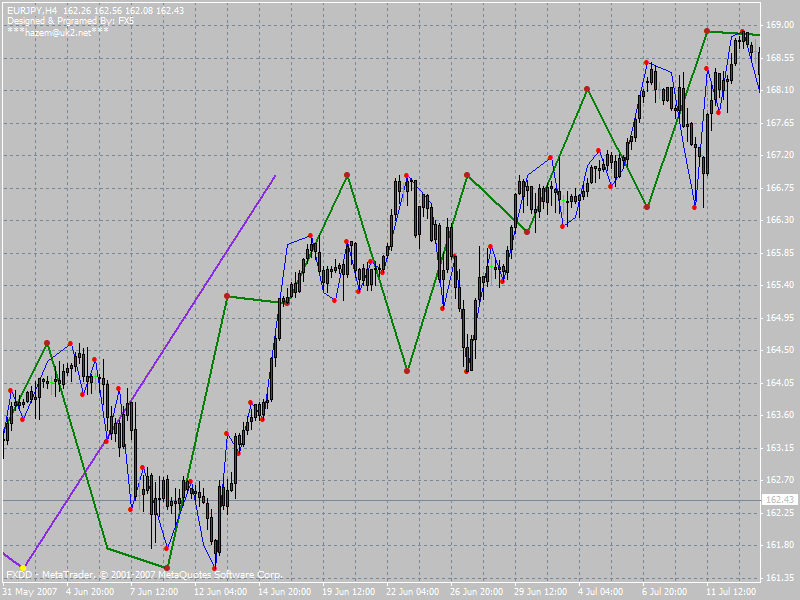
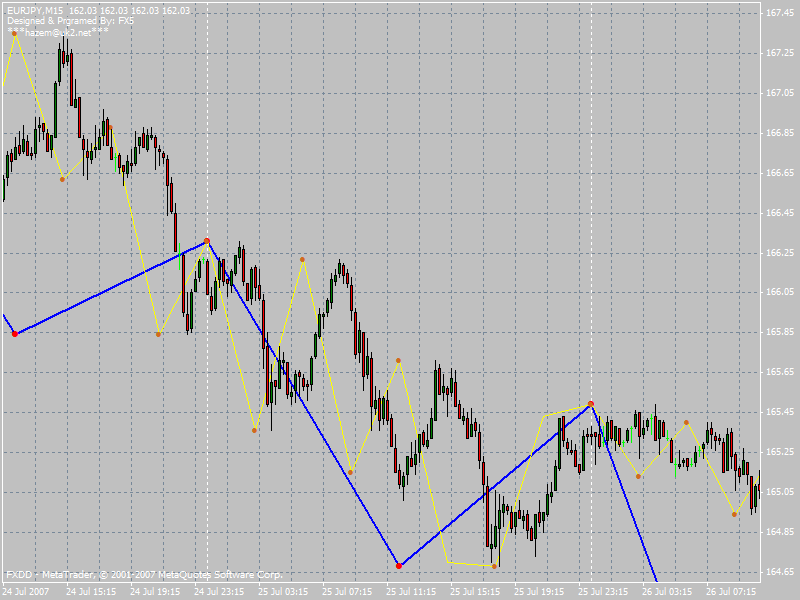
The indicator plots various levels of Monowaves on the various timeframes. The beginning and the ending of each monowave is marked by a dot or a small circle. There are four level plotted in four colors:
-Monthly (default color BlueViolet).
-Weekly (default color Green).
-Daily (default color Blue).
-Quarter Daily (default color Yellow).
All the colors can be changed through the indicator’s settings.
I hope this indicator proof to be a useful tool.
Good Luck.
Level up your trading with professional RobotFX expert advisors and indicators. Visit robotfx.org for proven MT4/MT5 tools.
7256


