
New free code from MQL5: indicators, EAs, and scripts for traders.
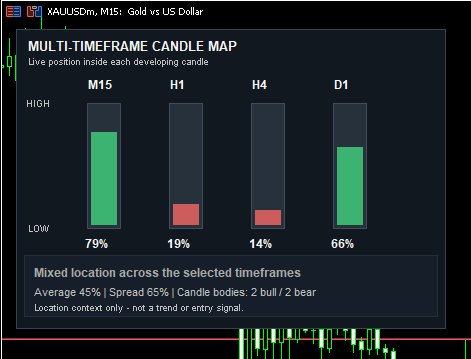
The idea is simple. A raw price distance is difficult to compare between M15, H1, H4 and D1 because every candle has a different range. The indicator normalizes the location into a percentage:
position = (current price - candle low) / (candle high - candle low) * 100
A reading near 0% means price is close to that candle's low. A reading near 100% means it is close to the high. Each timeframe is drawn as a vertical gauge so the relationship can be read without switching charts.
What the panel shows
- Four configurable timeframes
- Vertical price position from candle low to candle high
- Near Low, Lower Half, Upper Half and Near High classification
- Current candle body direction
- Time remaining before each candle closes
- Average position across the selected timeframes
- Spread between the highest and lowest readings
- A summary when several timeframes are located near the same edge
The spread value is useful when reading agreement. A small spread means the selected candles have similar normalized locations. A large spread means the timeframes are describing different parts of their ranges, so the context is mixed.
Inputs
InpTimeframe1 to InpTimeframe4 select the candles displayed in the panel.
InpUseBidPrice uses the live Bid price. When disabled, the current candle close supplied by CopyRates is used.
InpEdgeThreshold defines what is considered near a candle high or low. With the default value of 20, readings from 0-20% are Near Low and readings from 80-100% are Near High.
InpAlignmentCount controls how many timeframes must be near the same edge before the panel reports an alignment.
InpEnableAlerts optionally reports a new high-edge or low-edge alignment.
The code is also intended as a practical example for developers. It demonstrates CopyRates across multiple timeframes, percentage normalization, timer-based refresh, chart-object panels and state-controlled alerts.
This indicator does not predict direction and does not generate entry signals. A candle can be near its high and still reverse, or remain near its high while the trend continues. The readings should be treated as location context only.
Watch in-depth trading tutorials and EA reviews on the RobotFX YouTube channel. Subscribe for free tips.
Build better strategies with RobotFX professional tools – check them out.
74513


