
RobotFX curates the best open-source MetaTrader code to inspire your trading automation.
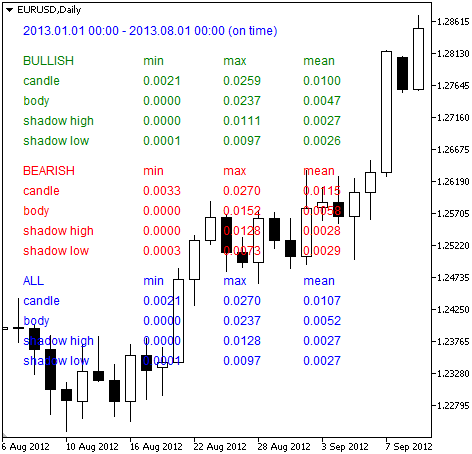
The script calculates candle statistics (the minimal, maximal and average values of candles body and shadows) of the current chart.
The calculated statistics is shown for 3 groups (bullish, bearish and all) of candles in the upper left corner of the chart.
Watch in-depth trading tutorials and EA reviews on the RobotFX YouTube channel. Subscribe for free tips.
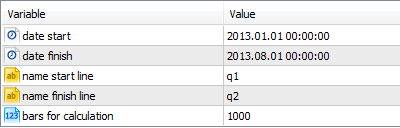
The calculation interval depends on 5 first input parameters (the interval also can be selected with two vertical lines with names, defined in input parameters).
How does it work:
- If there isn't any vertical lines (with names, defined by "start line" and "name finish line" inputs) and "bars for calculation"=0 - the start and finish dates are defined by values, specified in "date start" and "date finish" input parameters.
- If chart contains the vertical lines with names, defined by "start line" and "name finish line" inputs and bars for calculation=0 - the start and finish dates are defined by values, depending on time properties of these vertical lines.
- If bars for calculation > 0, it calculates the specified number of bars -1 (the current uncompleted bar is not used in calculations).
*If chart contains only one line ("name start line" or "name finish line"), or start time> finish time or bars for calculation< 0 - the script does nothing and finish its work.
Other input parameters:
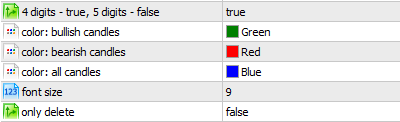
- Digits, 4 or 5 (used in normalization and string formatting);
- Colors of groups;
- Font size;
- Delete text labels from the chart (if true, the script only deletes the labels and does calculate nothing).
The code has comments.
Complement community code with advanced automation from RobotFX.
1842


