
RobotFX curates the best open-source MetaTrader code to inspire your trading automation.
Real author:
goldenlion@ukr.net
The indicator displays the support and resistance levels calculated on daily prices.
Watch in-depth trading tutorials and EA reviews on the RobotFX YouTube channel. Subscribe for free tips.
Support and resistance levels are calculated by the formulas:
P = (daily_high + daily_low + daily_close + daily_close) / 4;
R1 = P + P - daily_low;
S1 = P + P - daily_high;
R2 = P + daily_high - daily_low;
S2 = P - daily_high + daily_low;
R3 = P + P - daily_low - daily_low + daily_high;
S3 = P + P - daily_high - daily_high + daily_low;
This indicator was first implemented in MQL4 and published in the Code Base at mql4.com on 09.02.2008.
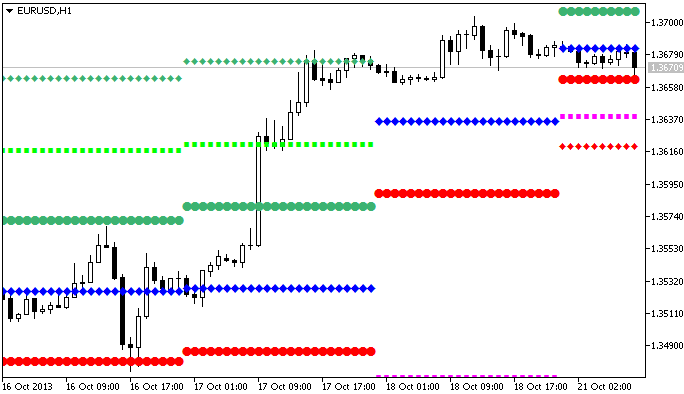
Figure 1. The i4_pivot_v1 indicator
Level up your trading with professional RobotFX expert advisors and indicators. Visit www.robotfx.org for proven MT4/MT5 tools.
1902


