
Discover expert developed MetaTrader tools that can complement professional solutions.
The following traits are particular to the Bollinger Band:
- abrupt changes in prices tend to happen after the band has contracted due to decrease of volatility;
- if prices break through the upper band, a continuation of the current trend is to be expected;
- if the pikes and hollows outside the band are followed by pikes and hollows inside the band, a reverse of trend may occur;
- the price movement that has started from one of the band’s lines usually reaches the opposite one.
The last observation is useful for forecasting price guideposts.
Grid trading done right – try the robust Grid Expert Advisor for controlled risk. Details here.
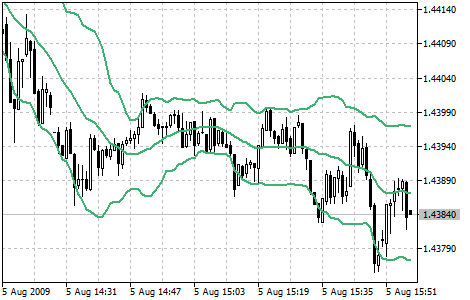
Bollinger Band indicator
Calculation:
Bollinger bands are formed by three lines. The middle line (ML) is a usual Moving Average.
ML = SUM (CLOSE, N) / N = SMA (CLOSE, N)
The top line (TL) is the same as the middle line a certain number of standard deviations (D).
TL = ML + (D * StdDev)
The bottom line (BL) is the middle line shifted down by the same number of standard deviations.
BL = ML - (D * StdDev)
where:
- SUM (..., N) - sum over N periods;
- CLOSE - close price;
- N - number of periods used in calculation;
- SMA - Simple Moving Average;
- SQRT - square root;
- StdDev - standard deviation:
StdDev = SQRT (SUM ((CLOSE — SMA (CLOSE, N))^2, N)/N)
It is recommended to use 20-period Simple Moving Average as the middle line, and plot top and bottom lines two standard deviations away from it. Besides, moving averages of less than 10 periods are of little effect.
Build better strategies with RobotFX professional tools – check them out.
14


