
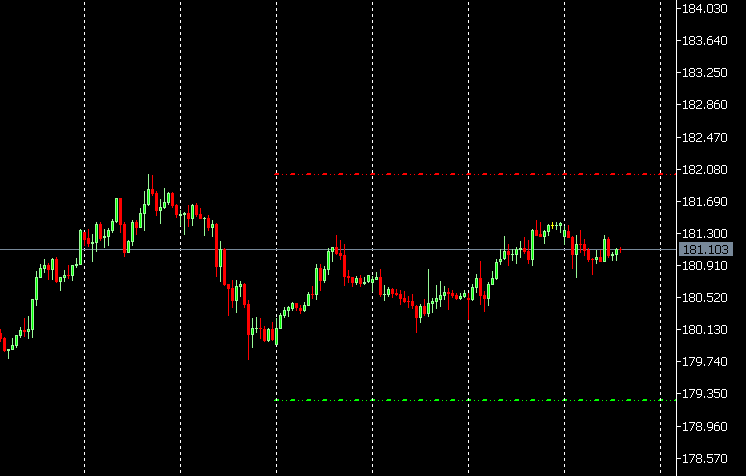
This indicator shows two horizontal line segments: Previous Week High (in your chosen color) Previous Week Low (in your chosen color)
These levels are useful for: Breakout or rejection trading, Weekly range analysis, Institutional level tracking (liquidity zones)
It Fetches previous week’s high & low. Draws them as horizontal lines covering the current week. Auto-updates every minute and Removes itself cleanly on exit.
-
Deletes the old line (if any)
-
Creates a new OBJ_TREND object with both points at the same price so it becomes horizontal
-
Applies all visual settings:
-
color
-
width
-
style
-
non-selectable
-
background mode
-
66670


