A multi-harmonic (or multi-tone) trigonometric model of a price series x[i], i=1..n, is given by:
x[i] = m + Sum( a[h]*Cos(w[h]*i) + b[h]*Sin(w[h]*i), h=1..H )
where:
- x[i] - past price at i-th bar, total n past prices;
- m - bias;
- a[h] and b[h] - scaling coefficients of harmonics;
- w[h] - frequency of a harmonic;
- h - harmonic number;
- H - total number of fitted harmonics.
Fitting this model means finding m, a[h], b[h], and w[h] that make the modeled values to be close to real values. Finding the harmonic frequencies w[h] is the most difficult part of fitting a trigonometric model. In the case of a Fourier series, these frequencies are set at 2*pi*h/n. But, the Fourier series extrapolation means simply repeating the n past prices into the future.
This indicator uses the Quinn-Fernandes algorithm to find the harmonic frequencies. It fits harmonics of the trigonometric series one by one until the specified total number of harmonics H is reached. After fitting a new harmonic, the coded algorithm computes the residue between the updated model and the real values and fits a new harmonic to the residue.
The indicator has the following input parameters:
- Npast - number of past bars, to which trigonometric series is fitted;
- Nfut - number of predicted future bars;
- Nharm - total number of harmonics in model;
- FreqTOL - tolerance of frequency calculations.
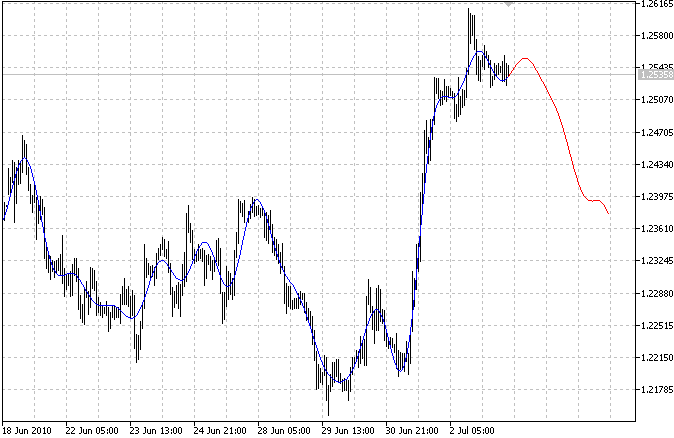
The indicator plots two curves: the blue curve indicates modeled past values and the red curve indicates the modeled future values.