
The EMA is one of the most widely used technical tools for trend identification and signal generation.
Features
-
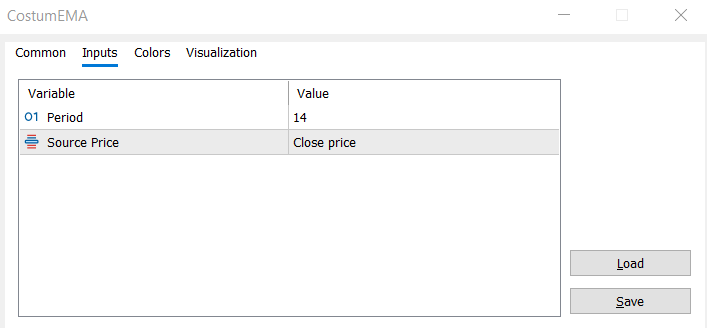
User-defined period for the EMA.
-
Choice of applied price: Close, Open, High, Low, Median, Typical, Weighted.
-
Smooth calculation using the standard EMA formula, initialised with an SMA of the first bars.
-
Lightweight, efficient, and easy to customise for your own strategies.
📊 How to Interpret
-
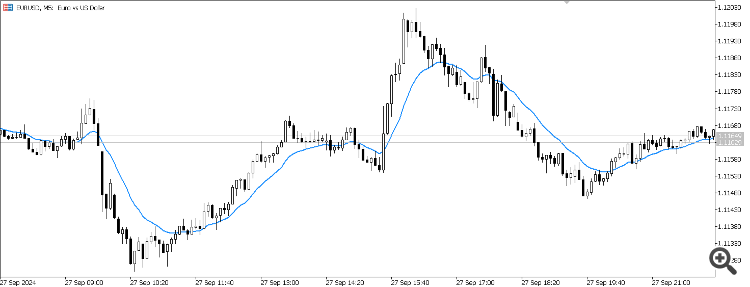
The EMA reacts faster to price changes compared to the Simple Moving Average (SMA).
-
When the price is above the EMA, it may indicate an uptrend;
when below the EMA, a possible downtrend. -
Often used in strategies such as:
- Trend-following
- Moving average crossovers (e.g., EMA 50 crossing EMA 200).
⚙️ Customisation
-
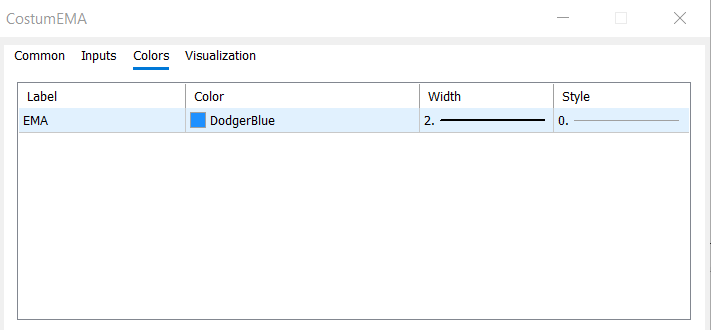
Adjust the line colour and thickness to your preference.
-
Modify the applied price and period directly in the input settings.
Why Use This Indicator?
-
Helps identify market direction quickly.
-
Can be a building block for advanced strategies.
-
Perfect for traders who want a clean and simple EMA implementation.


