Description:
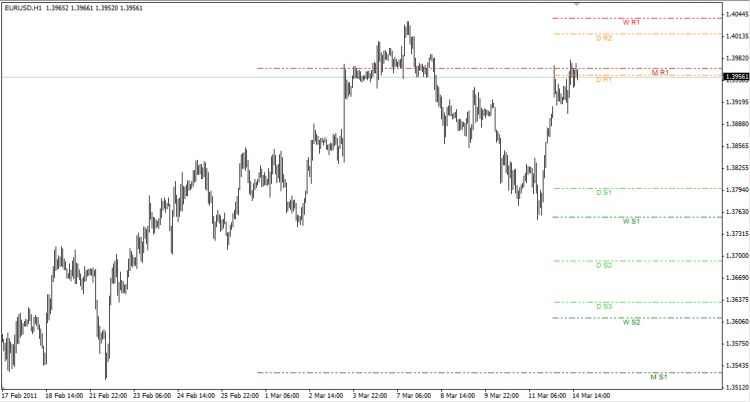
Here is an indicator, which draws daily, weekly and monthly pivots, support and resistance levels. All lines are drawn from the beginning of the timeframe (daily levels - from the beginning of the day etc.).
Update:
In v2 corrected issue on smaller timeframes, when labels did not show on chart. Now You can adjust label position by Yourself. Also, added customization possibility to change pivot, support and resistance lines type and width.