
The real author:
Andriy Moraru
The TradeBreakOut indicator reveals the distance from the actual price (Close or Maximum/Minimum prices) to the breakthrough of recently set support or resistance levels which were defined using local maximums and minimums.
When the green line reaches the zero point moving upwards, it speaks of the bullish breakthrough of the local maximum. When the red line reaches the zero point moving downwards, it signals about the bearish breakthrough of the local minimum. The more the distance from the zero level, the less the possibility of the breakthrough.
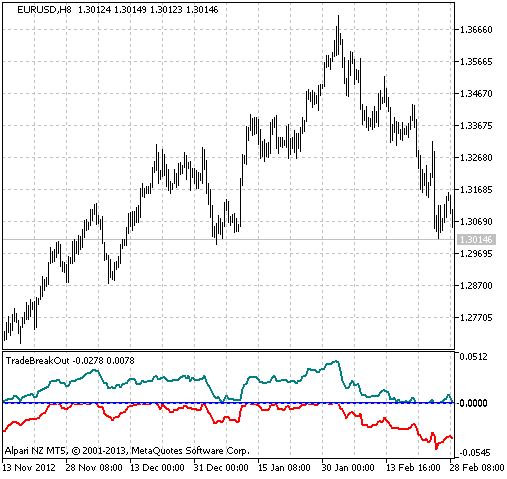
Fig.1 The TradeBreakOut indicator


