
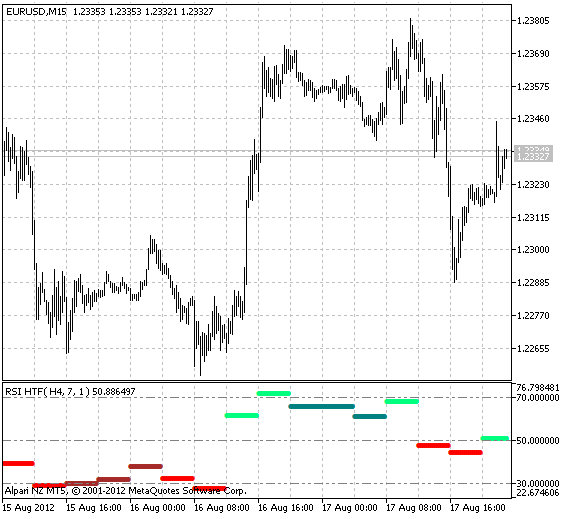
Standard RSI that can be applied for a chart having a different timeframe.
Ascending indicator values exceeding 50 are colored in light green, while descending ones - in dark green. Descending values below this value are shown in red, while ascending ones - in brown.
Indicator input parameters:
//+----------------------------------------------+
//|  Indicator input parameters                  |
//+----------------------------------------------+
input ENUM_TIMEFRAMES TimeFrame=PERIOD_H4;         // Chart period
input int RSI_Period = 12;                         // RSI period
input ENUM_APPLIED_PRICE AppliedPrice=PRICE_CLOSE; // Price constant
input bool ReDraw=true;                            // Repeat display of information in the empty bars
ColorRSI_HTF


