Real author:
Bill Sica
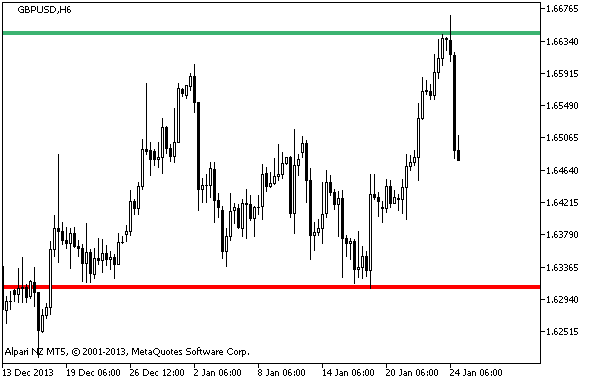
The indicator draws support and resistance lines, which are defined by the maximum and minimum for the last N bars.
Indicator input parameters:
//+----------------------------------------------+
//| Indicator input parameters                   |
//+----------------------------------------------+
input ENUM_TIMEFRAMES TimeFrame=PERIOD_D1; // Chart period
input uint  StartBar=1;                    // Start bar for analysis
input uint  HowManyBars=5;                 // Number of bars for analysis
//---
input color  Color_R=clrMediumSeaGreen;    // Color of resistance level
input STYLE  Style_R=SOLID_;               // Line style of the resistance level
input Width  Width_R=Width_2;              // Line width of the resistance level
//---
input color  Color_S=clrRed;               // Color of the support level
input STYLE  Style_S=SOLID_;               // Line style of the support level
input Width  Width_S=Width_2;              // Line width of the support level
Originally this indicator has been written in MQL4 and was first published in the Code Base at mql4.com on 25.09.2007.