1. Definition:
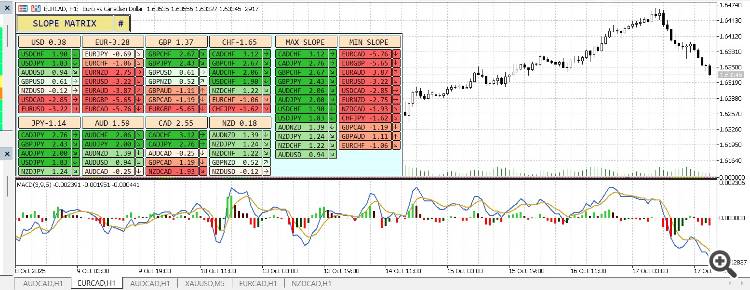
The MACD Histogram (MACD-H) is the bar chart component of the MACD indicator, representing the difference between the MACD line and the Signal line. Formula: MACD Histogram = MACD Line - Signal Line .
2. Core Meaning:
It measures the momentum of a trend, indicating whether the trend is accelerating or decelerating.
-
Bars lengthening & above the zero line: Buying momentum is strengthening.
-
Bars lengthening & below the zero line: Selling momentum is strengthening.
-
Bars shortening: Momentum is weakening, warning of a potential trend reversal or consolidation.
-
Bars crossing the zero line: Signals the crossover point between the MACD line and the Signal line.

Note: The MACD Histogram is a powerful signal filter, but it should be combined with other indicators and trend analysis for optimal results.
65050


