
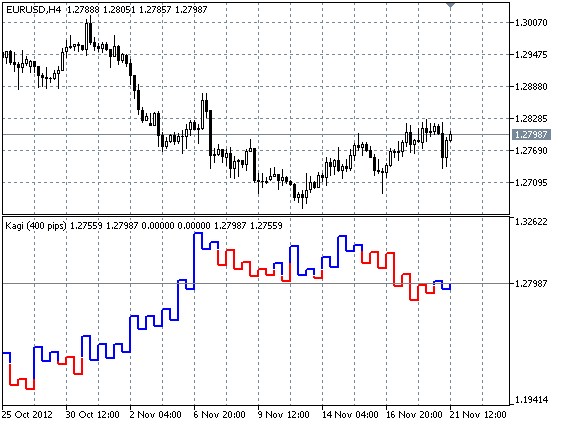
The Kagi chart is usually drawn on close prices and considers neither timeframe, nor volume. The idea is that if the market continues to move in the direction of the current Kagi line, the line is extended, and if the price goes in the opposite direction more than the set minimum reversal value then the line is drawn in the opposite direction. If there is breakthrough of the previous minimum (maximum) in the rollback then the line changes the color indicating about reversal.
Recommendations:
- The very simple principle is to buy when "yang" (blue line), to sell when "yin" (red line).
- After reversal wait for the confirmation in the form of a second vertical line of the same color in direction to a new trend.
- A more detailed description of the Kagi charts and their use can be find in the book by Steve Nison "Beyond Candlesticks".


