This script makes horizontal lines, that shows max and min value of price in some time you wrote.
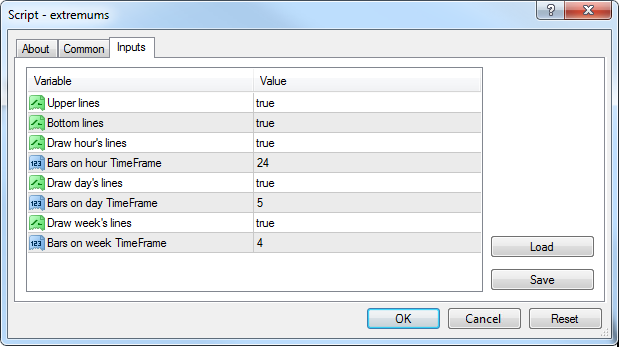
You can choose what script would show:
- Upper lines - asks if you want to draw lines which show highs;
- Bottom lines - the same about lines which show lows;
- Draw hour's lines - work on one hour timeframe (H1);
- Bars on hour TimeFrame - how many hours script would count;
- Draw day's lines - work on one day timeframe (D1);
- Bars on day TimeFrame - how many days script would count;
- Draw week's lines - work on one week timeframe (W1);
- Bars on day TimeFrame - how many weeks script would count.