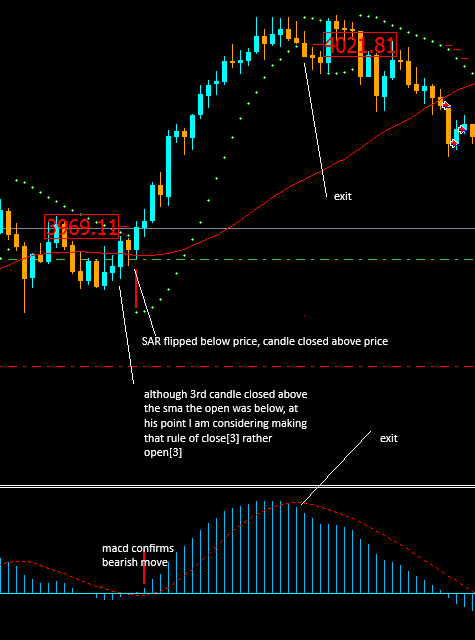
So far this expert is based on a 15 min bar or candle chart, so the MACD is used as early indication of direction. the focus is on the parabolic sar as first signal to indicate a buy or sell secondly it looks where the closed of bar or candle indicated on the chart if the third candle back was below sma and previous candle closed was above sma and sar flipped below the price. that constitute as a buy signal, if macd shows bullish move and sar flipped below price but previous candle close (close[1]) is still below the sma it waits for 5 candles window for price to close above the sma.
Be low is examples of the idea
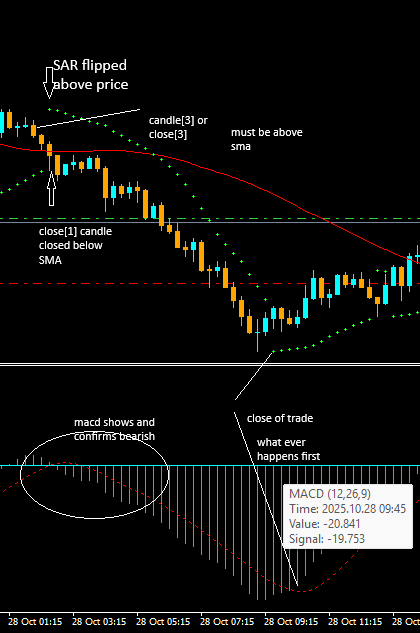
the idea is that as soon as the candle close below the sma the 3rd candle should be above the sma and within that time frame the SAR should also flipped above the price, by this time macd confirms either at the same time or few candles back a bearish move.
this picture shows a buy