
The ColorZerolagMomentumOSMATrend_x10 indicator shows the ColorZerolagMomentumOSMA oscillator direction from ten different timeframes.
Falling oscillator movement paints the squares in purple, growing movement — in light blue. Otherwise, the squares are gray. The indicator uses the values of the last closed bars.
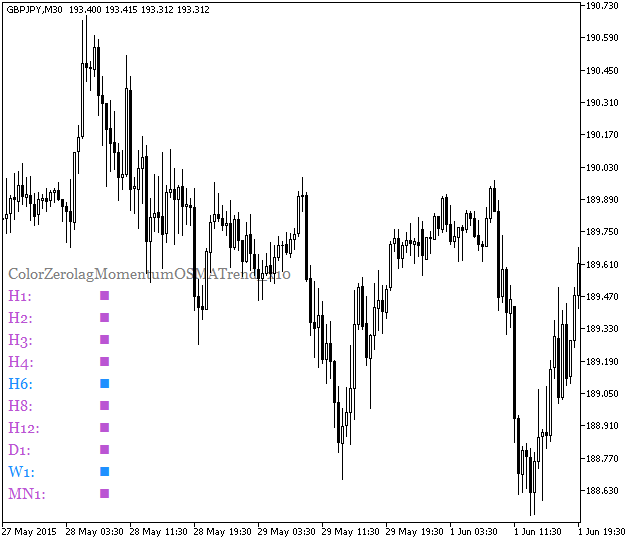
Fig.1. The ColorZerolagMomentumOSMATrend_x10 indicator


