
The StochasticTrend_x10 indicator shows the Stochastic oscillator position from ten different timeframes.
If the oscillator is positioned lower than the oversold level, the color squares are painted in pink, if it's higher than the overbought level, the squares are painted in green. Otherwise, the squares are gray. The indicator uses the values of the last closed bars.
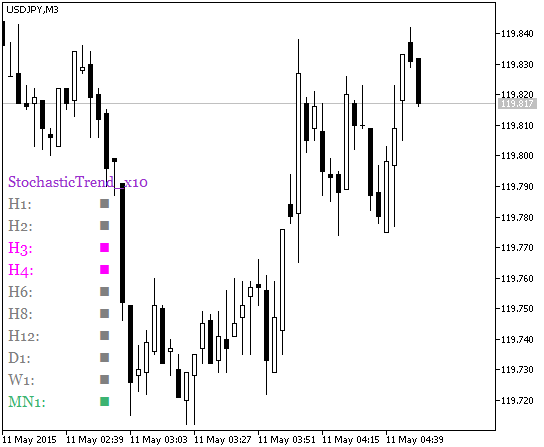
Fig.1. The StochasticTrend_x10 indicator


