
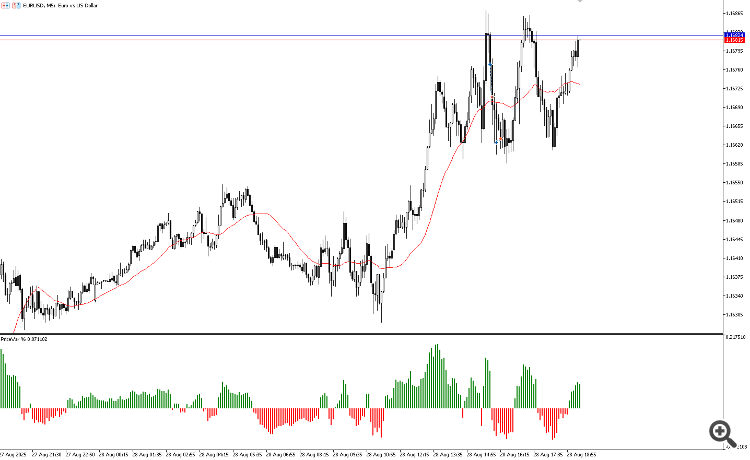
PriceVar% is an indicator designed to measure the percentage difference between the price and a moving average, highlighting the strength of the market movement in relation to a reference value.
How it works
-
If the closing price is above the average, the calculation is:
-
If the closing price is below the average, the calculation is:
Var = (Low - MA) / MA * 100;
The result is displayed as a percentage histogram (%):
-
Green → when the price is above average (buying force).
-
Red → when the price is below average (selling force).
Interpretation
-
Positive values indicate the distance of the high from the average.
-
Negative values indicate the distance of the low from the average.
-
The higher the absolute value, the greater the percentage distance of the price from the average.
Practical applications
-
Identifying moments of overbought/oversold relative to the average.
-
Measuring percentage volatility around the average.
-
Aid in breakout or reversal strategies by validating the intensity of the movement.
-
Use as a filter in automated systems (e.g. only trade when the percentage change exceeds a certain threshold).
Parameters
-
Average period (iPeriod): defines the horizon of the moving average used as a reference.


