
Price gaps indicator implemented as a histogram. Red bar — up gap and, most likely, will fill down. Blue bar — down gap, will fill up.
There is also a function which allows you to filter gaps by size. If you set a positive value for inpBigGap parameter, the BigGap line will appear in a subwindow. All gaps lower than this line will be painted in gray.
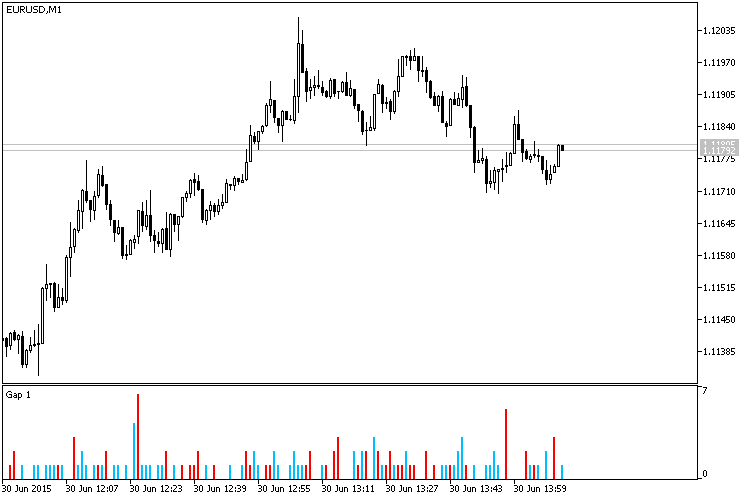
Fig.1. М1 timeframe. inpBigGap = 0
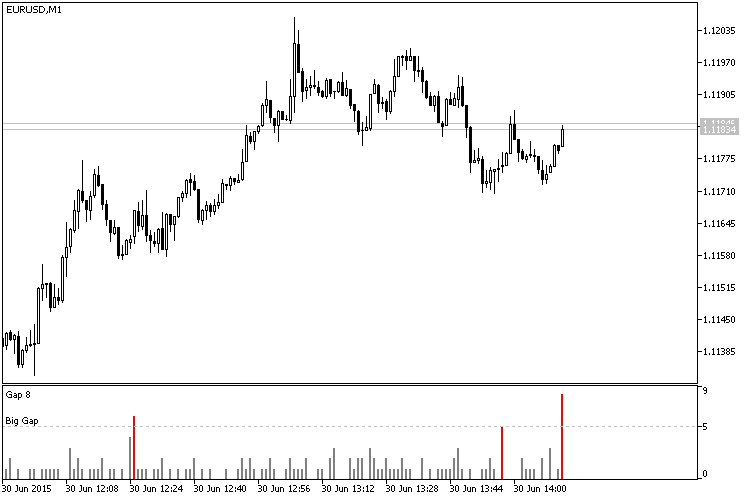
Fig.2. М1 timeframe. inpBigGap = 5
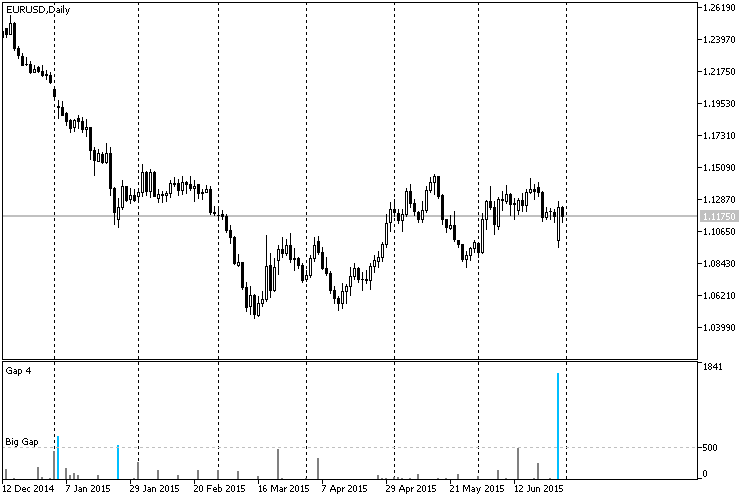
Fig.3. D1 timeframe. inpBigGap = 500


