
For the higher chart timeframes: H4, D1, W1 using Slow = false (0), and for smaller chart timeframes: H1, M30, M15, M5 set Slow = true (1). Arrows appear.
If Signal = 3 (the best is 8), it calculates the Moving Average as 1x2 + 2x2 + 3x2 (minus) 1x3 - 2x3 - 3x3, less than separate.
     while(count>0)
      {
       dif=iMA(NULL,0,(count*2),0,3,0,i)-
           iMA(NULL,0,(count*3),0,3,4,i)+
           iMA(NULL,0,(count*2),0,3,4,i)-
           iMA(NULL,0,(count*3),0,3,1,i);
       if(count>=Signal/2)ExtGreenBuffer[i]+=dif;
       if(dif!=0.0)dif/=(count+1)/2;
       if(count+1<=Signal)ExtSilverBuffer[i]+=dif;
       count--;
If used in experts: it can be used as Buffer 2 [Method 2] (if> 0.0) = Buy, Buffer 3 [Method 3] (if <0.0) = Sell.
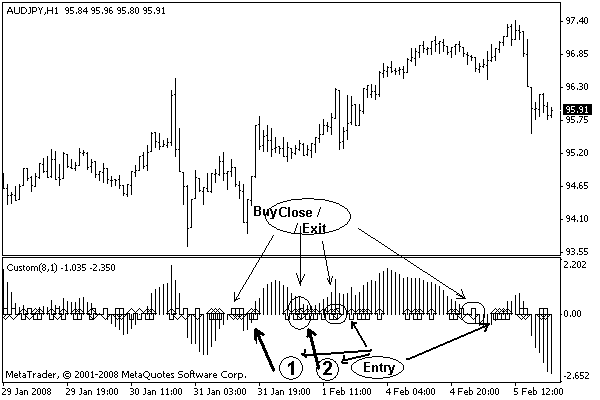
Entry: Combination of D1 with H4 with H1 is good and can be a signal, if all of them received the same signal, it must not be on the same bar.
Exit : If H1 or H4 changes - it is a signal to close the position.
After the optimization is complete and results are received, the optimizer can be removed from the chart.


