Traders Dynamic Index oscillator defines and displays trend direction, as well as market power and volatility.
The indicator features eleven customizable parameters:
- RSI period - RSI calculation period
- RSI applied price
- Volatility band period
- RSI smoothing period
- RSI smoothing method
- Signal smoothing period
- Signal smoothing method
- Overbought - overbought level
- Oversold - oversold level
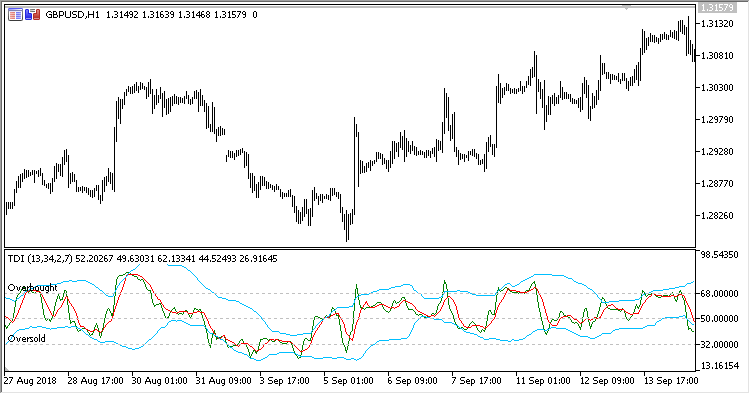
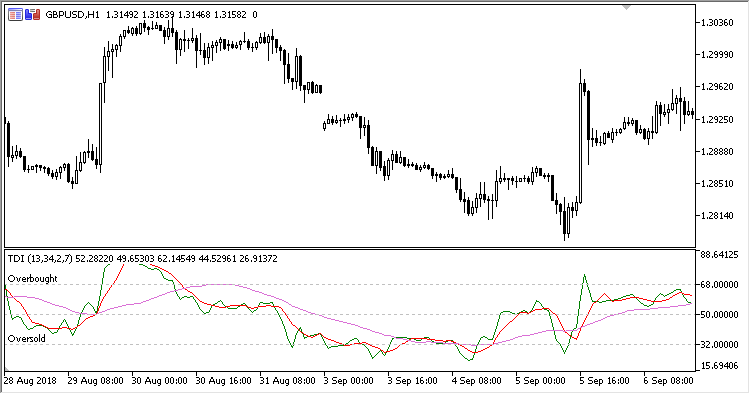
- Show Market Base line (Yes/No)
- Show Volatility band lines (Yes/No)
Interpretation:
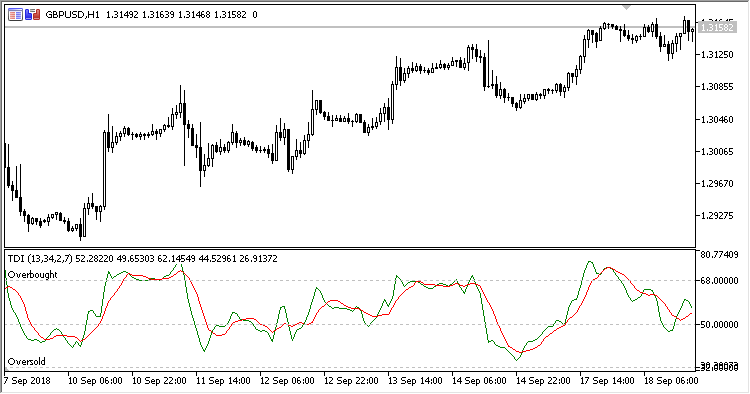
In general case:
when the green RSI line goes over the red one, it means the market is bullish. when the green RSI line is below the red one, it means the market is bearish.
Base market line:
It is recommended to trade when the line is in the range from the overbought to the oversold level. When the market base line approaches the range borders, expect a trend direction change.
Volatility bands:
when the market is fast and active, the bands expand - trade in the direction of RSI and signal lines. During quiet periods, consolidations, waiting for news, etc., the bands are narrowed. If the bands are in a narrow range for a long time, expect a strong price spike and start of movement.