
Real author: Sevan62
Smoothed differential indicator by Sultonov. Indicator lines show the averaged accumulated sums of bulls and bears power for the user-defined period.
Calculation method
Bulls power is calculated by the following formula:
BullsPower(i) = SUM(Close(i) - Close(i + 1), N) / BUN
where:
- BullsPower(i) - current bulls power.
- Close(i) - Close price of the current bar.
- Close(i + 1) - Close price of the previous bar.
- N - indicator calculation period.
- BUN - number of positive increments of Close prices over N bars. The sum includes only positive increments.
Accordingly, the following formula is used for calculating the bears power:
BearsPower(i) = SUM(Close(i + 1) - Close(i), N) / BEN
where:
- BearsPower(i) - current bears power.
- BEN - number of negative increments of Close prices over N bars. The sum includes only negative increments.
The final indicator features additional smoothing of obtained lines.
//+-----------------------------------+ //| INDICATOR INPUTS | //+-----------------------------------+ input uint i_nPeriod=1000; // calculation period input Smooth_Method XMethod=MODE_SMA_; // smoothing averaging method input uint XLength=12; // smoothing depth input int XPhase=15; // smoothing parameter, //---- For JJMA, changing within -100 ... +100, affects the transient process quality; //---- For VIDIA this is CMO period, for AMA this is a slow average input Applied_price_ IPC=PRICE_CLOSE_; // price constant input int Shift=0; // indicator horizontal shift in bars
Interpretation
The indicator consists of two lines filling space between them in color corresponding the trend direction. The higher line shows the stronger side. The intersection of lines (color change) indicates trend change and is a good moment for opening a deal in the direction of the power that appeared to be above the other one.
The indicator uses the classes of the SmoothAlgorithms.mqh library. Working with that class was described in details in the article "Averaging Price Series for Intermediate Calculations Without Using Additional Buffers".
The original indicator was developed in the MQL4 language and published in CodeBase on 22.09.2017.
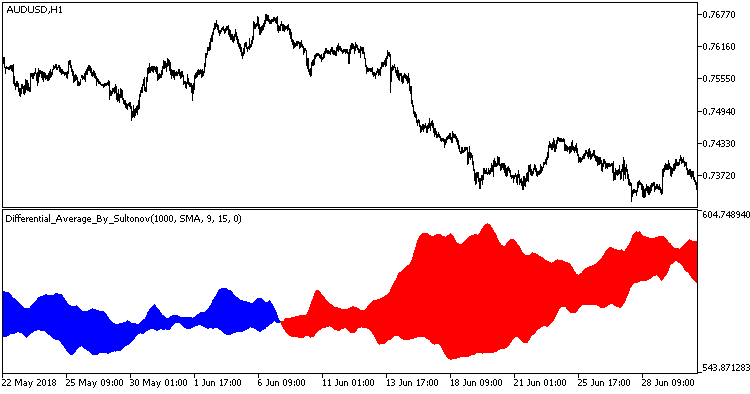
Fig. 1. Differential_Average_By_Sultonov indicator


