
Indicator Polynomial Regression Slope draws a regression curve as a histogram that fits best with the prices between the initial and end points of the price.
There are three adjustable parameters:
- Period - calculation period (regression line length in bars);
- Power - defines the "strength" of the polynomial to be calculated;
- Applied price - price used for calculations.
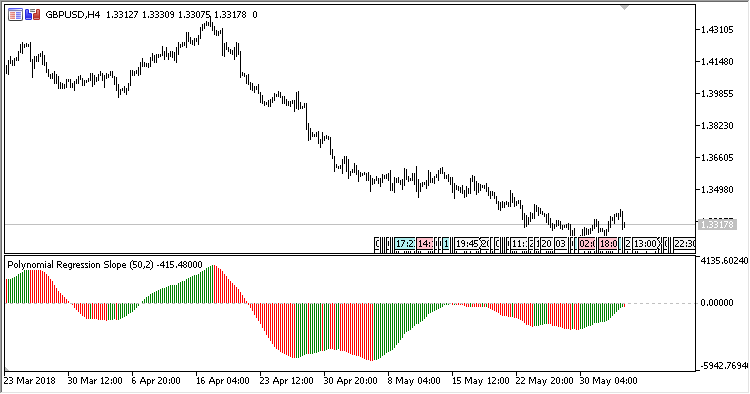
Fig 1. Power = 2, Period = 50
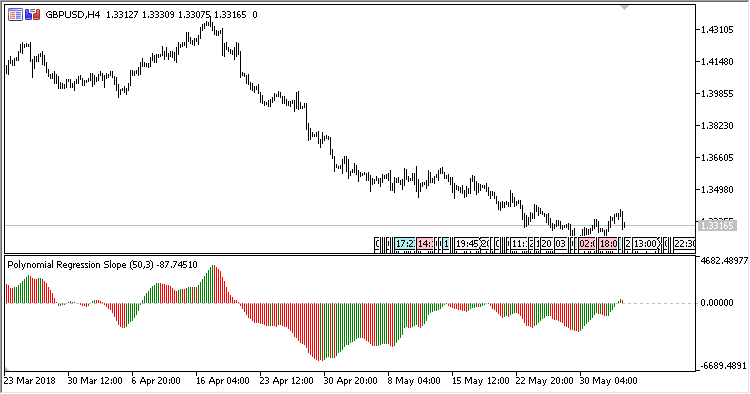
Fig. 2. Power = 3, Period = 50
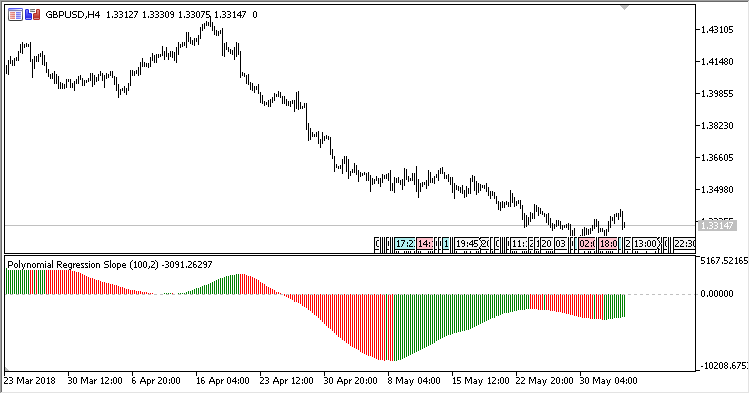
Figure 2. Power = 2, Period = 100
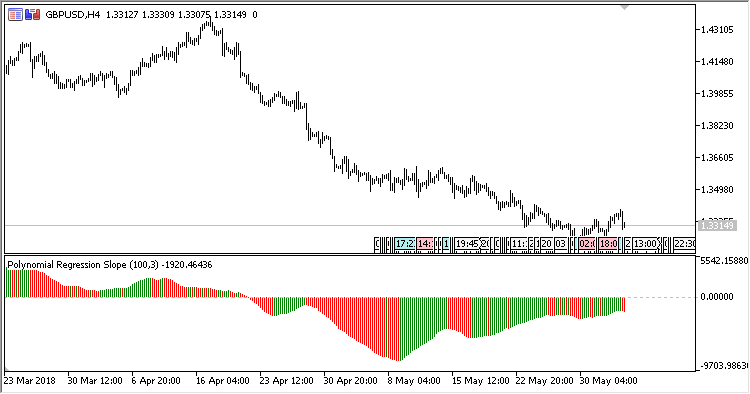
Figure 4. Power = 3, Period = 100


