
Oscillating indicator Multi timeframes Stochastic RSI is the multi-timeframe Stochastic RSI.
The indicator displays the data of three indicators Stochastic RSI from different timeframes on the current chart.
It has ten input parameters:
- Stochastic %K period - stochastic %K line calculation period
- Stochastic %D period - stochastic %D line calculation period
- Stochastic slowing - stochastic slowing calculation period
- RSI period - RSI calculation period
- Overbought - overbought level
- Oversold - oversold level
- Drawing mode - drawing mode
- Steps - by steps
- Slope - by sloping lines
- First Stochastic RSI timeframe - first Stochastic RSI timeframe
- Second Stochastic RSI timeframe - second Stochastic RSI timeframe
- Third Stochastic RSI timeframe - third Stochastic RSI timeframe

Fig. 1. Multi timeframes Stochastic RSI, Drawing mode = Steps
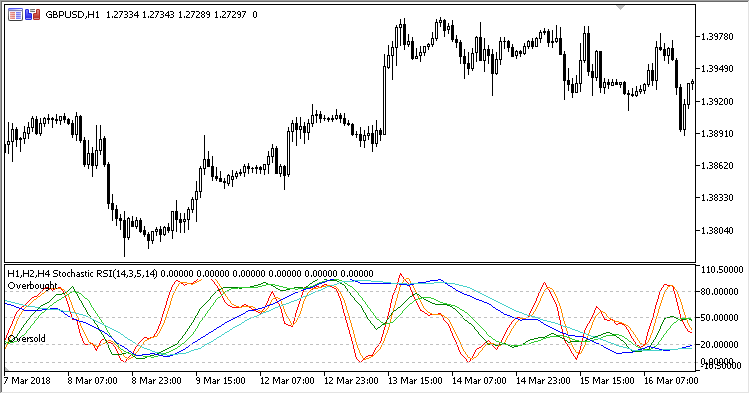
Fig. 2. Multi timeframes Stochastic RSI, Drawing mode = Slope


