
Indicator MACD Overlay displays the chart as colored candles according to the data from oscillator MACD.
It has five adjustable parameters:
- Data MACD Compare mode - MACD data comparison mode
- MACD and signal Lines - MACD line and signal line
- MACD vs zero line - MACD line referred to zero
- Current and previous MACD values - comparing the current and previous values of the MACD line
- MACD fast EMA period - MACD indicator's fast EMA calculation period
- MACD slow EMA period - MACD indicator's slow EMA calculation period
- MACD period signal line - MACD indicator's signal line calculation period
- MACD applied price - MACD indicator's calculation price
MACD and signal Lines:
- If the MACD line is above the signal line,
then the bullish candle is displayed in green
the bearish candle is displayed in light-green
- If the MACD line is below the signal line,
then the bearish candle is displayed in red
the bullish candle is displayed in light-red
MACD vs zero line:
- If the MACD line is above zero,
then the bullish candle is displayed in green
the bearish candle is displayed in light-green
- If the MACD line is below zero,
then the bearish candle is displayed in red
the bullish candle is displayed in light-red
Current and previous MACD values:
- If the MACD line values grow,
then the bullish candle is displayed in green
the bearish candle is displayed in light-green
- If the MACD line values fall,
then the bearish candle is displayed in red
the bullish candle is displayed in light-red
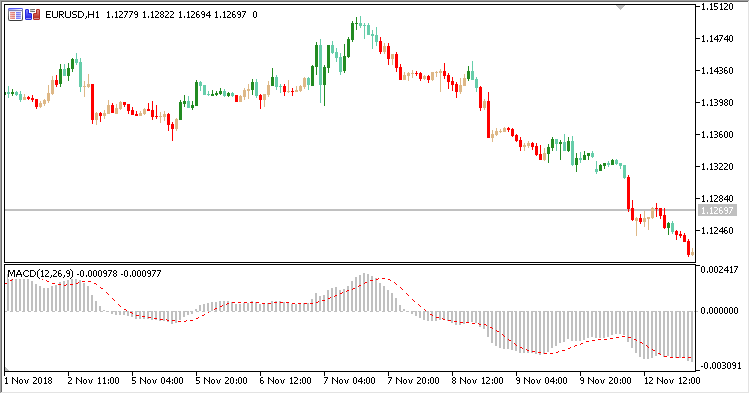
Fig. 1. MACD Overlay + MACD. Data MACD Compare mode = MACD and signal Lines
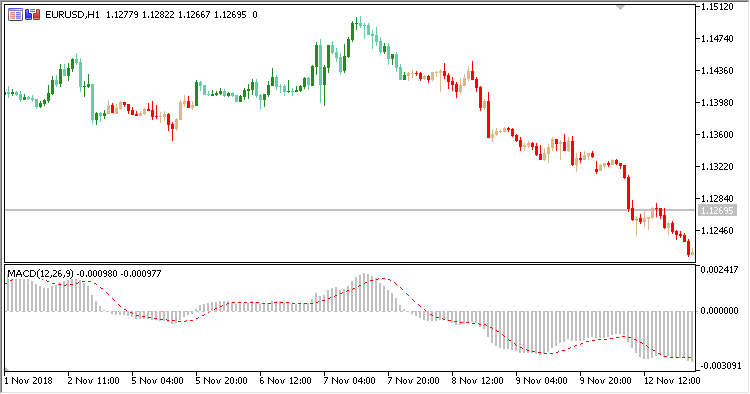
Fig. 2. MACD Overlay + MACD. Data MACD Compare mode = MACD vs zero line
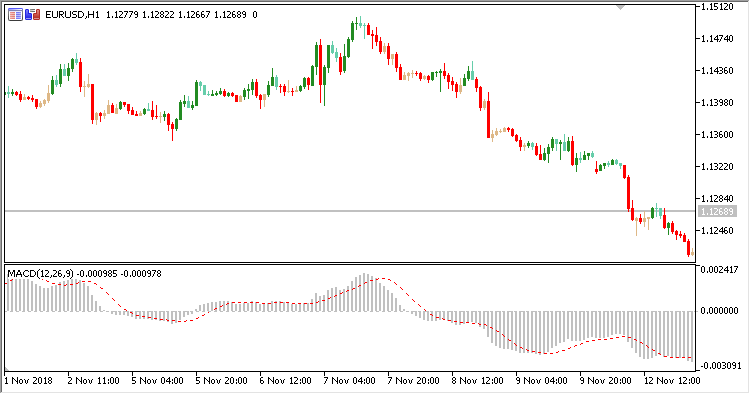
Fig. 3. MACD Overlay + MACD. Data MACD Compare mode = Current and previous MACD values


