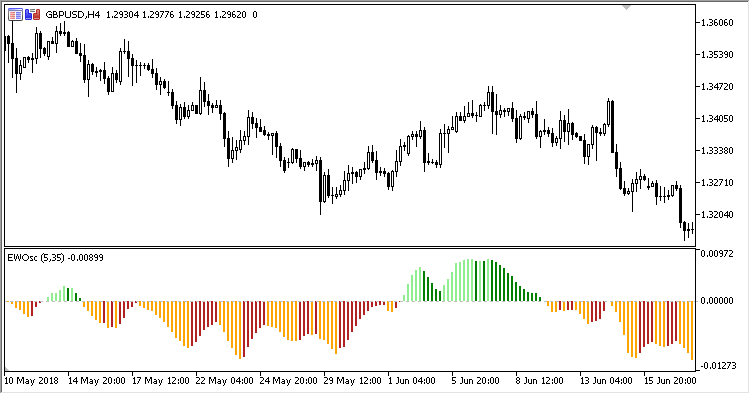
Elliot Wave Oscillator displays the difference between two moving averages as a colored histogram.
It has four inputs:
- Fast MA period
- Slow MA period
- Method - МА calculation method
- Applied price - МА calculation price
Calculation:
EWO = FastMA - SlowMA
where:
FastMA - MA(Applied price, Fast MA period, Method)
SlowMA - MA(Applied price, Slow MA period, Method)
- If the histogram is above zero and the indicator values are rising, the histogram bars are colored light-green
- If the histogram is above zero and the indicator values are falling, the histogram bars are colored dark-green
- If the histogram is below zero and the indicator values are falling, the histogram bars are colored orange
- If the histogram is below zero and the indicator values are rising, the histogram bars are colored dark-red