Theory :
This "ribbon" indicator is using an EMA variation indicator that was originally published (with some more explanation) here : EMA variation
This version :
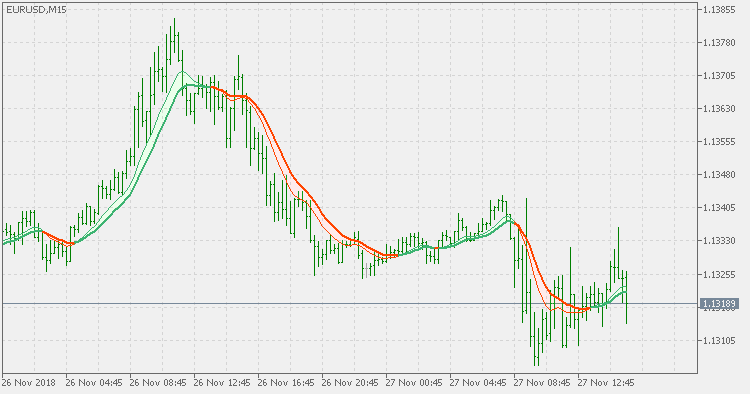
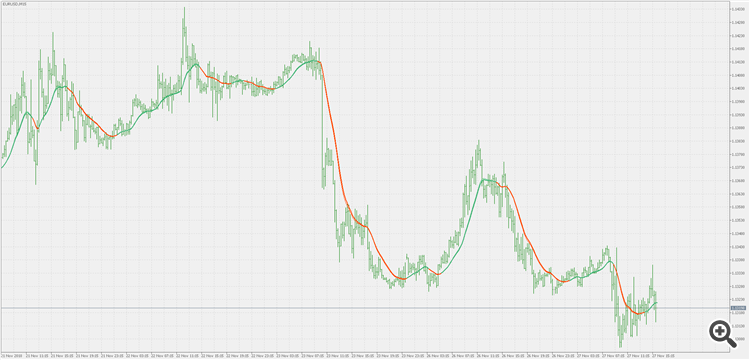
It is using the "speed" property of the ema variation indicator to construct a ribbon. That makes a sort of two indicators crosses, even without changing the calculating period.
Usage :
As any crosses indicator. Interesting results can be achieved when you use very close "speed" changes (like in the example bellow)