
'Three timeframes RSI Average' displays in a separate window three Relative Strength Index indicator of the specified timeframes, as well as their average value.
It has ten input parameters:
- RSI period - RSI calculation period
- Overbought - overbought level
- Oversold - oversold level
- Drawing mode - indicator drawing type
- Steps - as a ladder
- Slope - sloping lines
- First RSI timeframe - the timeframe of the first RSI
- Second RSI timeframe - the timeframe of the second RSI
- Third RSI timeframe - the timeframe of the third RSI
- Show first RSI - show the first RSI indicator
- Show second RSI - show the second RSI indicator
- Show third RSI - show the third RSI indicator
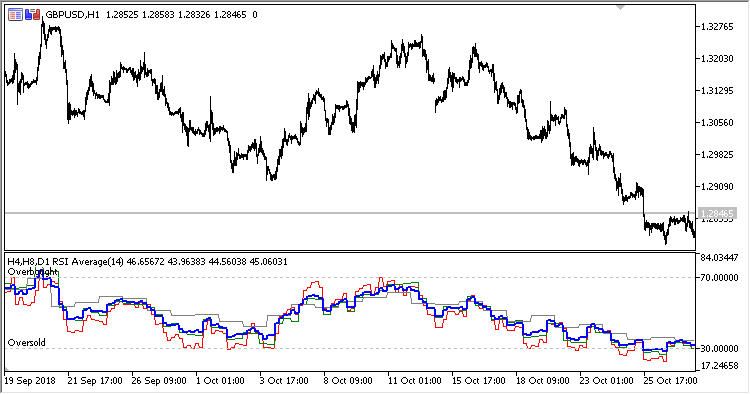
Fig.1. Three timeframes RSI Average, H4, H8 and D1 data on the H1 chart, Drawing mode = Steps
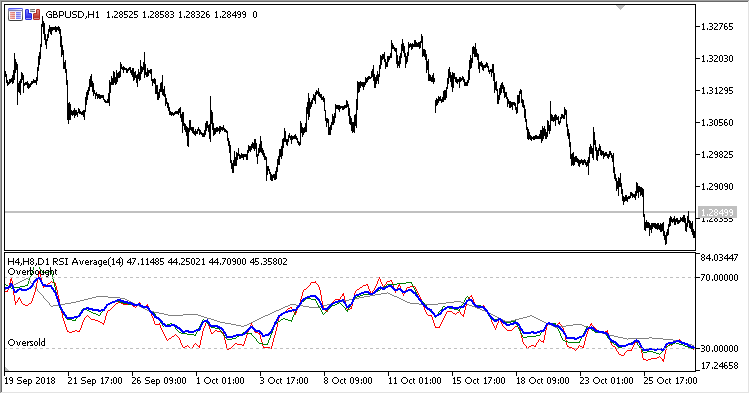
Fig. 2. Three timeframes RSI Average, H4, H8 and D1 data on the H1 chart, Drawing mode = Slope


