
This indicator calculates an Adaptive RSI using tick data and plots it along with fast and slow moving averages in a separate window. It provides options to customize the calculation periods, moving average types, and visual settings.
It was a conversion from an ancient 2008 MT4 indicator made by Rosh at trend laboratory, but at the time, a different RSI indicator was loaded.
This time it will load the default RSI indicator that comes with the installation of MT5.
You can say that it "transforms" the RSI with a slow and fast moving average based on tick calculations.
Here is a comparison with the default RSI that comes with MT5, and the RSI adaptive:
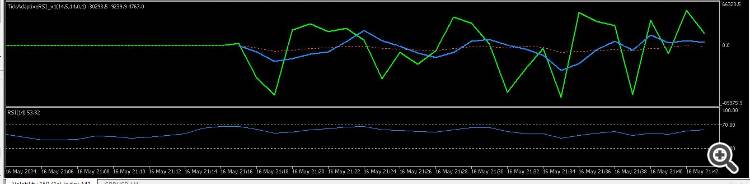
The green plot is the tick price plot, the blue plot is the fast RSI line, the red plot is the slow RSI line.


