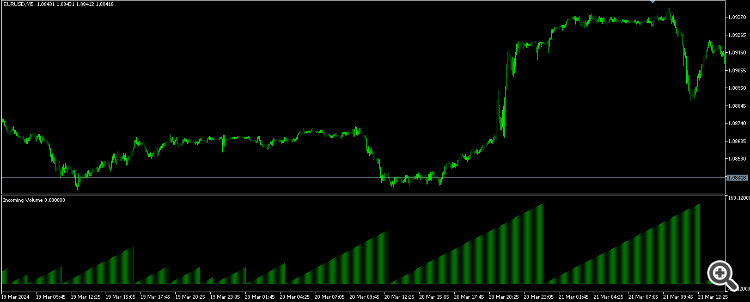
It's possible to plot incoming volume rather than simply plotting a single volume histogram bar to describe volume in the bar.
Instead of just showing total volume per bar like a standard volume indicator, this indicator plots how volume evolves tick by tick.
This indicator therefore provides a real-time view of volume pressure. If a bar has high tick activity, the histogram will show an increasing trend and amplify in size.If the market has weaker volume, the histogram will reveal weaker peaks.
This creates a linear progression of tick volume in tick time, to visualize volume accumulating for a single bar in a different way.
It can be useful for:
Detecting sudden volume surges in real time.
Tracking microstructural changes in the market.
Understanding volume build-up during a bar's formation.
Spotting absorption or exhaustion (if volume spikes but price doesn't move much).