
Main Features
-
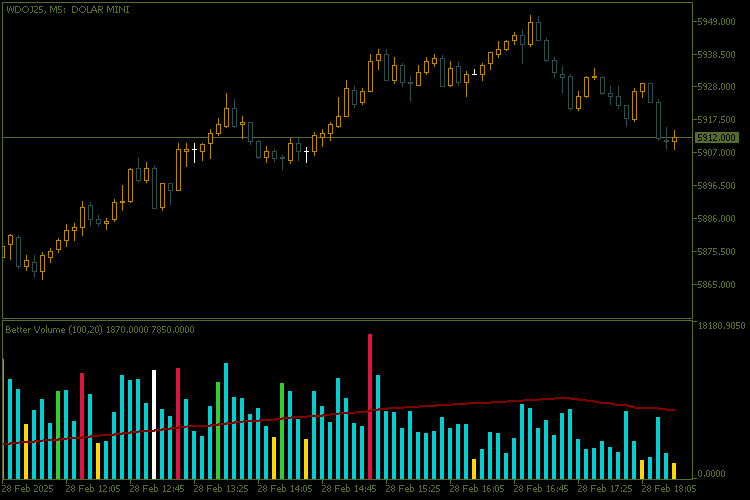
Dynamic Volume Categorisation :
- The indicator classifies volume into various categories, assigning different colours to facilitate visual interpretation:
- Buying Climax ( clrCrimson ): Identifies moments when volume is extremely high and the price is rising.
- Selling Climax ( clrLimeGreen ): Signals moments of strong selling pressure with high volume.
- Churn ( clrGold ): Detects high volatility without a clear price direction.
- Climax Churn ( clrMagenta ): Combines buy/sell climax with churn, indicating extreme volatility.
- Weak Candle ( clrDarkTurquoise ): Identifies candles with minimal volume in the lookback window.
- Volume Balance ( clrWhiteSmoke ): Represents standard volume, with no specific characteristics that classify it in other categories. This colour is used as a "base colour" when none of the above patterns are detected.
- The indicator classifies volume into various categories, assigning different colours to facilitate visual interpretation:
-
Moving Average Volume :
- A smoothed moving average line ( clrMaroon ) is displayed to help identify trends in volume over time.
-
Advanced Customisation :
- Moving Average Period : Adjust the moving average period to adapt the indicator to your trading style.
- Lookback Window : Set up the lookback window to compare the current volume with recent values.
- Volume Type : Choose between real volume ( VOLUME_REAL ) or tick volume ( VOLUME_TICK ) to suit the characteristics of the asset being analysed.
-
Clear visual interface :
- A coloured histogram ( DRAW_COLOR_HISTOGRAM ) displays the volume categories in an intuitive way, allowing for quick and efficient analysis.
-
Flexibility for Different Timeframes :
- The indicator works on any timeframe, from intraday charts to weekly or monthly charts.
How to interpret the signals
- Buy/Sell Climax : Indicates moments of strong accumulation or distribution, suggesting possible trend reversals or continuations.
- Churn : Signalling high volatility without a clear direction, indicating uncertainty in the market.
- Weak Candles : Shows moments of low activity in the market, often associated with consolidations or periods of indecision.
- Volume Balance : Represents normal market behaviour, without significant anomalies. It is useful for identifying areas of stability.
Configuration and Use
Better Volume is easy to set up and use:
- Add the indicator to your chart in MetaTrader 5.
- Adjust the parameters as necessary:
- Moving Average Period : Sets the smoothness of the moving average line.
- Lookback Window : Determines the number of candles used for comparisons.
- Volume Type : Choose between real volume or tick volume.
- Observe the signals generated by the histogram and the moving average line to make informed decisions.
Why Use Better Volume?
- Volume Flow Analysis : Better understand the behaviour of market participants based on volume.
- Pattern Identification : Detect buy/sell climaxes, churn and other important patterns that can influence your trading decisions.
- Ease of Use : The intuitive visual interface and customisation options make the indicator accessible to both beginners and experienced traders.
Application example
- Use the indicator to confirm entry/exit signals in volume-based strategies.
https://www.mql5.com/en/charts/20770866/wdoj25-m5-banco-btg-pactual


