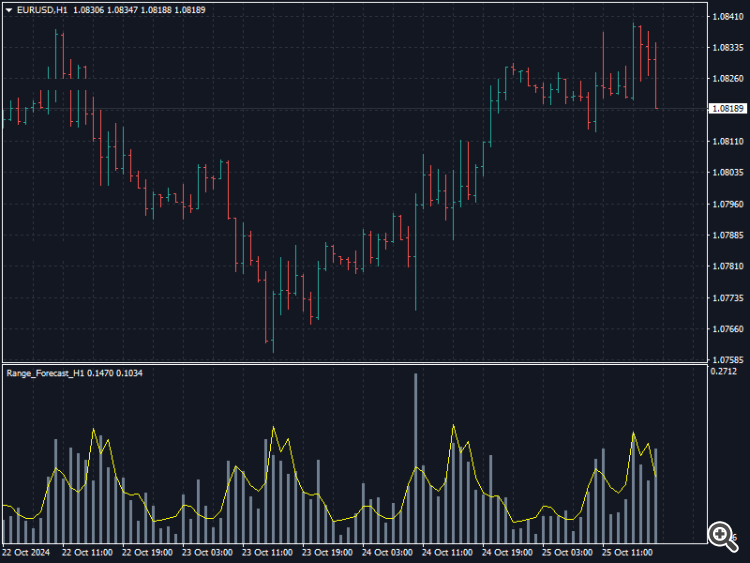
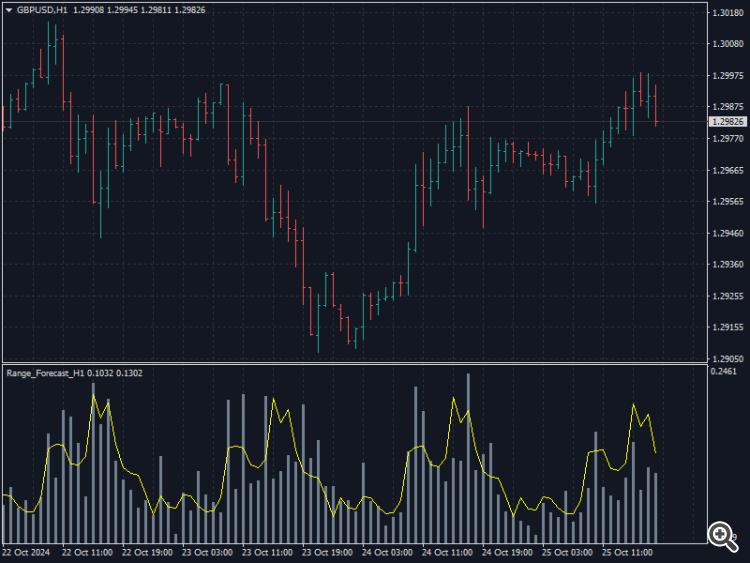
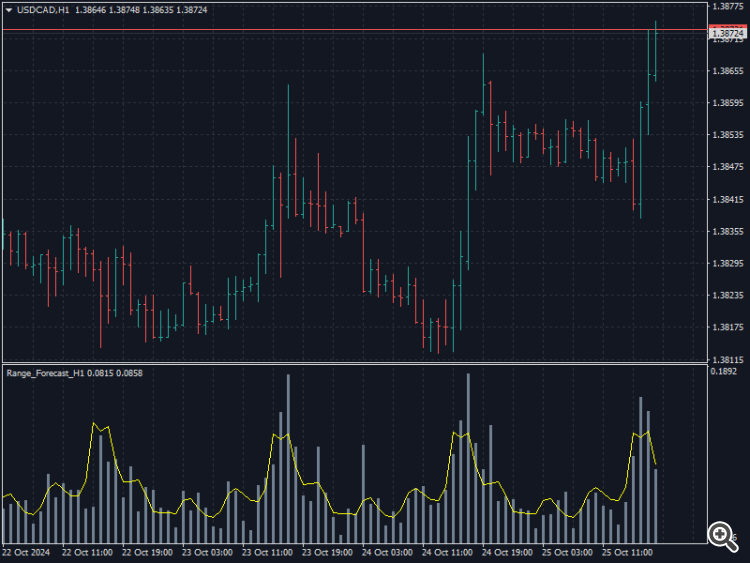
The indicator displays the actual range of the hourly candle in percent and the calculated range based on average statistics.
Indicator parameters:
Averaging Period - averaging period for calculating the relative range indicator.
Number Of Bars For Statistics - number of bars in history for collecting average statistics data for a trading instrument.
Shifting Start Of Statistics Calculation - shift from which bar to start collecting statistics so that the readings do not affect the last N data.
Histogram Size - histogram bar size (actual range).
Line Size - line size (forecast range).
Histogram Color - histogram color.
Line Color - line color.
How to understand the indicator readings:
1. Histogram bars display the actual range of the H1 candle as a percentage (%).
2. Line is the calculated value of the H1 candle range as a percentage (%) based on the average statistics.
!!! The indicator works only on the H1 chart period.